Model monitoring in 2026: A complete guide for ML teams
You've built monitoring for uptime and latency, but monitoring ML models in production needs statistical validation your current stack doesn't provide. Schema changes corrupt features, data distributions shift as markets move, and concept drift changes how inputs map to outputs while every service health metric stays green. These failures separate ML systems from traditional software because they're silent. No exceptions fire when your model trains on historical data then faces live inputs with completely different distributions, leaving you blind until accuracy decays enough to show up in business metrics.
TLDR:
- Model monitoring requires statistical validation beyond uptime tracking to catch silent failures
- Track drift types separately: data drift (input changes), concept drift (outcome changes), and prediction drift
- Automated CI/CD testing validates accuracy, fairness, and security before every deployment
- Openlayer runs 100+ tests across development and production with real-time guardrails and compliance mapping
Core production challenges for ML models
ML models break differently than traditional software. A deployment runs without errors, serves predictions on schedule, and still produces bad outputs. These silent failures separate ML monitoring from standard observability. So how does ML fail? Training-serving skew hits first. Your model trains on historical data, then faces live inputs with different distributions. Schema changes, missing features, or unexpected ranges degrade accuracy while logs stay clean. But, data drift follows quickly. Input distributions shift as behavior changes, markets move, or new patterns appear. And, concept drift runs deeper: the relationship between inputs and outputs changes. What predicted churn last quarter fails this quarter, but no exceptions fire.
Standard monitoring tracks uptime and latency. ML needs statistical validation on prediction batches, baseline comparisons, and pattern shift detection that logs can't catch.
Types of model drift and their business impact

Data drift occurs when input distributions shift. A fraud model trained on 2024 transaction patterns sees different spending behaviors in 2025. Feature values change, correlations break, and statistical properties diverge from training baselines. There are three kinds of drift:
- Concept drift. The relationship between features and outcomes changes. A credit model's risk indicators stay stable, but economic conditions alter what constitutes default risk. Inputs look familiar, but predictions miss.
- Prediction drift. This tracks output distributions. If a churn model suddenly flags 40% of users instead of the usual 15%, something broke upstream or the model learned spurious patterns.
- Feature drift. This isolates individual variable changes. One corrupted data source, one API schema update, one timezone bug can degrade accuracy while other features remain stable.
Core metrics for monitoring ML models in production
While there are lots of metrics you can look at, such as latency, memory usage, throughput, and error rates, the core metrics fall into three primary categories:
- Data quality metrics catch corrupted inputs before they degrade performance. Monitor missing values, schema violations, type mismatches, and range anomalies.
- Model quality metrics measure predictive performance. Classification models require accuracy, precision, recall, F1 scores, and AUC-ROC. Regression models track MAE, RMSE, and R². Ground truth labels often arrive delayed in production.
- Business KPIs connect predictions to outcomes. A recommendation model tracks click-through rate and revenue. A fraud detector balances false positive costs against fraud losses.
Data quality and pipeline monitoring
Most production failures trace back to data pipelines, not models. An upstream schema change, a corrupted feed, or a missing join silently breaks predictions while the model runs without error. Schema validation can catch type mismatches, missing columns, and unexpected nulls before inference; while monitoring cardinality changes in categorical features and value ranges in numeric ones. A feature that suddenly contains 90% nulls or a category code that never appeared in training signals upstream corruption.
Just keep in mind that external data providers introduce risk. APIs change formats, third-party feeds delay, and vendor updates break contracts. Track freshness timestamps, record counts, and distribution statistics for every external source.
Detecting and responding to model drift
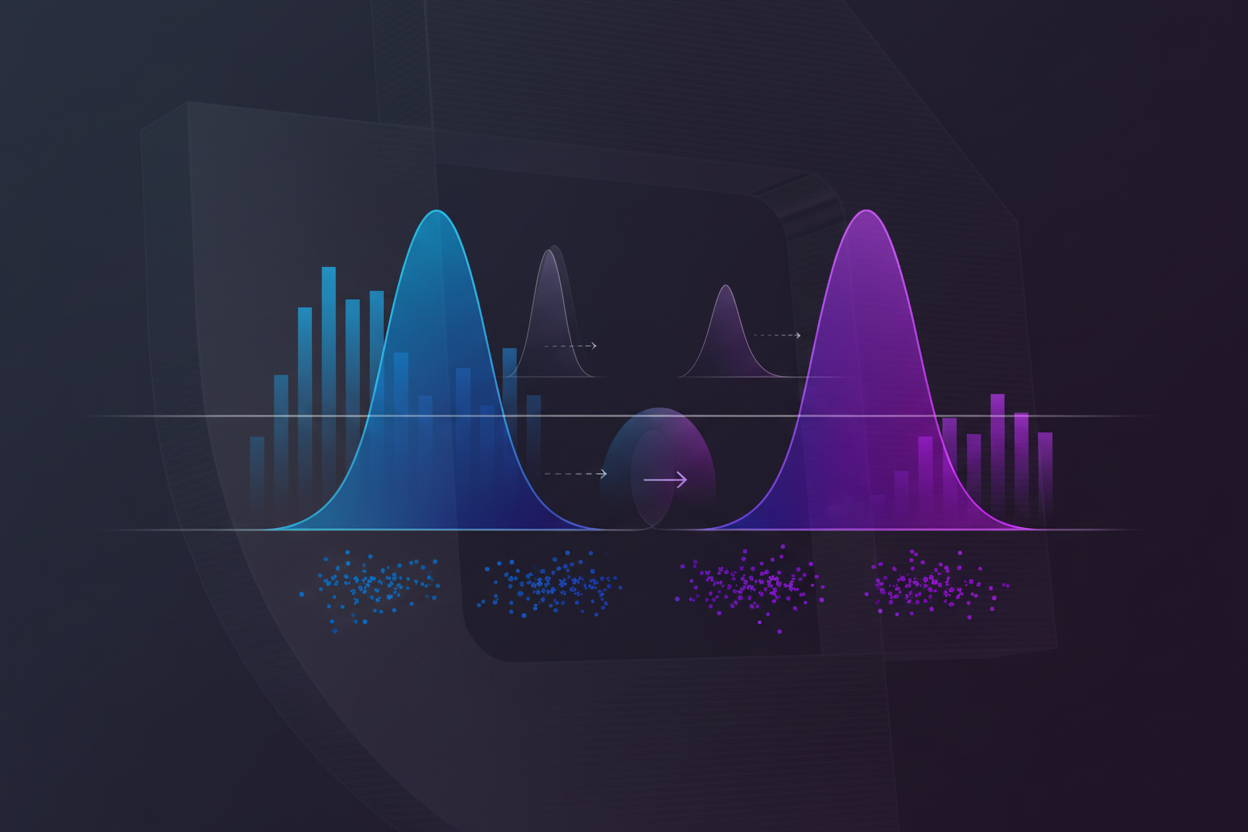
Statistical tests quantify drift objectively. The Kolmogorov-Smirnov test, for example, measures maximum divergence between cumulative distributions. Jensen-Shannon divergence, on the other hand, calculates similarity between probability distributions. Finally, Population Stability Index (PSI) compares how feature distributions shift across bins, with values above 0.2 signaling action. The table below provides a quick overview of the different detection methods, what they measure, best use cases, and their alert thresholds.
| Detection Method | What It Measures | Best Use Case | Alert Threshold |
|---|---|---|---|
| Kolmogorov-Smirnov Test | Maximum divergence between cumulative distribution functions of training and production data | Continuous numerical features with unknown distributions | p-value below 0.05 indicates meaningful drift |
| Jensen-Shannon Divergence | Symmetric measure of similarity between two probability distributions, bounded between 0 and 1 | Categorical features and discrete distributions where symmetry matters | Values above 0.3 signal meaningful divergence |
| Population Stability Index (PSI) | Compares feature distribution changes across binned ranges, measuring magnitude of change per bin | Credit scoring and financial models where interpretability is critical | PSI above 0.1 warrants investigation, above 0.2 requires action |
| Wasserstein Distance | Minimum cost to convert one distribution into another, accounting for distance between values | Features where magnitude of shift matters more than frequency changes | Compare against baseline variance, alert when exceeding 3x historical range |
| Chi-Square Test | Statistical independence between observed and expected frequency distributions | Categorical features with known expected distributions | p-value below 0.05 with sufficient sample size |
One of the considerations you should keep in mind is that automated retraining should kick in when drift crosses predefined thresholds or when ground truth validation shows accuracy decay. You should combine recent production samples with historical training data, weighting newer observations higher if trends are directional.
Monitoring challenges unique to AI systems
LLMs produce non-deterministic outputs, making baseline comparisons harder than tracking fixed model metrics. For example, success criteria can shift. What defines a good response? Traditional accuracy metrics fail when measuring generated text for coherence, relevance, or factual correctness. You need groundedness checks and retrieval quality tests absent from classic ML workflows. But the biggest challenge is that hallucinations appear without error signals. Models generate plausible but false information. Detection, then, requires verifying factual claims against source documents in real time.
Remember too that context sensitivity creates failure modes. Small prompt variations produce drastically different outputs which means that token limits truncate context unpredictably. Retrieval systems surface irrelevant passages that corrupt responses downstream.
Automated testing and CI/CD integration for ML
CI/CD integration treats models like code: every change triggers validation before merge. Software tests check syntax and logic. ML tests validate data schemas, statistical distributions, and model performance against benchmarks.
In this integration with your pipline, test suites run automatically on commits, data validation confirms input schemas match expectations and feature distributions stay within acceptable ranges, and performance tests compare accuracy, latency, and fairness metrics against baseline thresholds set from previous production runs. Version control extends beyond code to include datasets, model weights, and test configurations. Gate deployments on test results. If accuracy drops below threshold, drift exceeds limits, or fairness tests fail, the pipeline blocks promotion to production.
Real-time monitoring and alerting strategies
If you are going to monitor your model, it needs to be done continuously and in real-time. Here are a few strategies to consider as you develop your own:
- Alert systems should balance sensitivity with alert fatigue. Set thresholds using historical variance instead of fixed percentages. If accuracy typically fluctuates 2% weekly, a 5% drop signals investigation.
- Route critical alerts like PII leakage or service downtime to Slack or PagerDuty for immediate action. Send drift warnings and performance degradation reports via email for daily review.
- Match dashboard refresh rates to decision cycles. Hourly rollups catch sudden failures. Daily or weekly views reveal trends and seasonal patterns in prediction distributions. Account for cyclicality to avoid false alarms during expected traffic movement.
Monitoring architectures and implementation patterns
Of course, your model is only one part of the overall system. In addition to tracking drift and other key real-time KPIs, you need to monitor the architecture and how the different technology components part of your agentic stack are implemented. Here are some monitoring considerations to keep in mind:
- Batch monitoring aggregates predictions hourly or daily, computing drift statistics and performance metrics on windows of data. Real-time monitoring checks individual predictions as they occur, blocking requests that fail security checks or quality thresholds.
- Store prediction logs in object storage (S3, GCS) or data warehouses (Snowflake, BigQuery) for analysis. Stream metrics to time-series databases like Prometheus or InfluxDB for dashboard visualization and alerting.
- Architect data flows to capture inputs, outputs, and metadata at inference time. Send prediction logs asynchronously to avoid latency penalties. Process batches with scheduled jobs that compute drift tests and model quality metrics.
Model monitoring for compliance and governance
Finally, you can't escape the need to monitor your model's compliance with regulatory frameworks and other governance requirements. Here's what to keep in mind about monitoring compliance:
- Regulators require proof of ongoing oversight, not point-in-time assessments. Frameworks like NIST AI RMF and EU AI Act mandate continuous risk monitoring, bias tracking, and decision documentation throughout a model's lifecycle.
- Fairness metrics must be tracked across protected demographic groups. Monitor accuracy, precision, recall, and false positive rates segmented by age, gender, geography, or other sensitive attributes. Disparate impact ratios quantify whether one group receives systematically worse outcomes.
- Audit trails capture every prediction with timestamps, model versions, input features, outputs, and confidence scores. When regulators question a decision made months ago, retrievable records show what data the model saw and which version produced that output.
How Openlayer handles model monitoring at scale
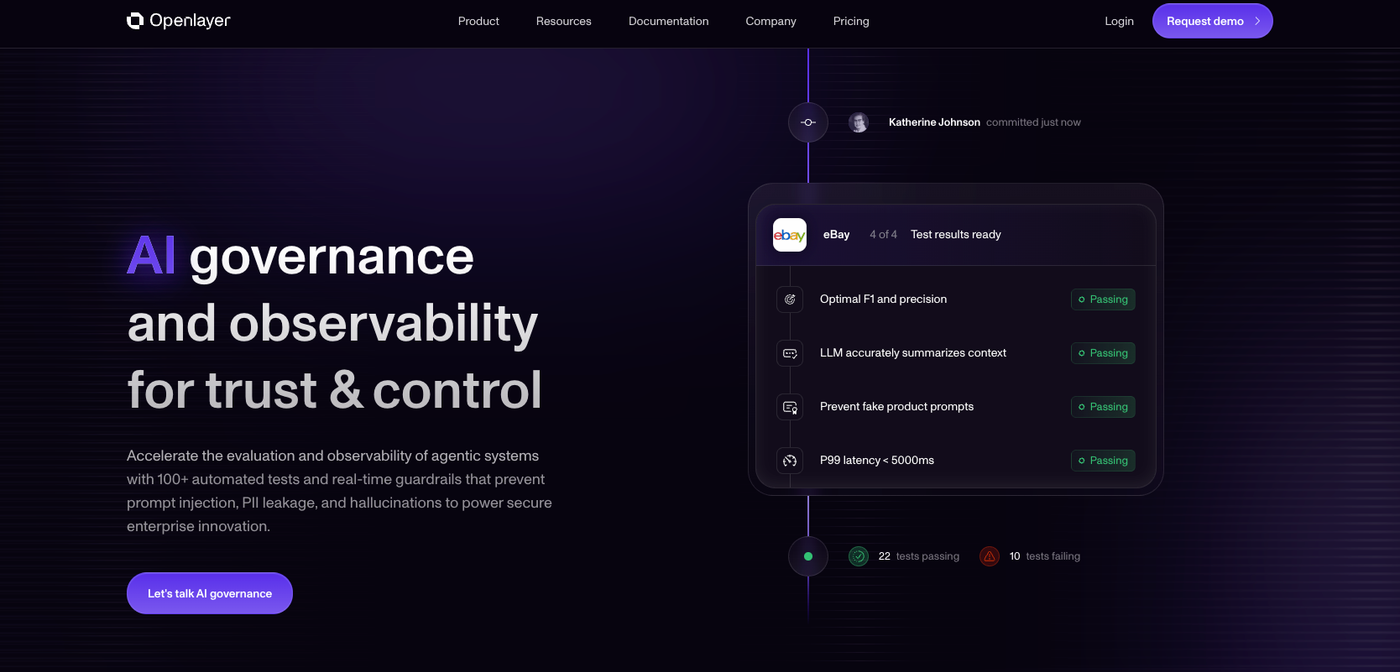
Openlayer unifies development and production monitoring in one system. Run the same 100+ automated tests across text, vision, tabular, and audio models during CI/CD and against live production traffic. Tests validate quality (hallucinations, bias, toxicity), performance (latency, throughput), and security (prompt injections, PII leakage) without separate tooling. Continuous monitoring detects anomalies and drift in real time, with alerts firing when metrics cross thresholds or predictions fail validation. Security guardrails block malicious inputs and data exfiltration before reaching downstream systems.
Compliance dashboards map projects to EU AI Act, NIST RMF, and OWASP automatically, collecting evidence as models run. Track ML models, agents, and RAG applications with full trace visibility, drilling from aggregate drift statistics down to individual failed predictions for root cause analysis.
Final thoughts on production model monitoring
The gap between model deployment and reliable production performance closes with proper model monitoring techniques. Drift detection, quality validation, and automated testing convert silent failures into visible signals you can act on. Your monitoring strategy should catch degradation in statistical distributions - beyond infrastructure metrics - before predictions corrupt downstream decisions.
FAQ
What's the difference between data drift and concept drift?
Data drift occurs when input distributions shift, like a fraud model seeing different transaction patterns than it was trained on. Concept drift means the relationship between inputs and outputs changes, such as when economic conditions alter what constitutes credit risk even though feature values remain stable.
How do I set alert thresholds without creating alert fatigue?
Base thresholds on historical variance instead of fixed percentages. If accuracy typically fluctuates 2% weekly, set alerts for drops exceeding 5%. Route critical failures like PII leakage to real-time channels (Slack, PagerDuty) while sending drift warnings and performance degradation to email for daily review.
When should I trigger automated model retraining?
Retrain when drift crosses predefined thresholds or when ground truth validation shows accuracy decay. Combine recent production samples with historical training data, weighting newer observations higher if trends are directional instead of seasonal fluctuations.
What metrics should I track for LLM monitoring versus traditional ML models?
Traditional ML models track accuracy, precision, recall, and statistical drift metrics. LLMs require additional monitoring for hallucinations, groundedness (factual claims verified against sources), context relevance, and PII leakage - outputs that can fail silently without triggering standard error logs.
How can I prove compliance with regulations like EU AI Act through monitoring?
Maintain audit trails capturing every prediction with timestamps, model versions, input features, outputs, and confidence scores. Track fairness metrics segmented by protected demographic groups, and store retrievable records showing what data the model processed and which version produced each output.