Announcing our $14.5M Series A!
Read the blog post

Changelog

Stay up to date with the latest changes to Openlayer

Complete design system overhaul, Snowflake Integration

Complete design system overhaul, Snowflake Integration

This month, we’re excited to unveil our brand new UI! We’ve defined an improved design system, including updated and thoughtfully-crafted styles and components to give the product a fresh, engaging look and feel. The new design system supports both light and dark modes, so be sure to check out both and find the one that suits you.

With the new look, we’ve made a number of other experience improvements, including adding priority levels for tests, improving the navigation and information hierarchy, and adding more data visualizations throughout the product.

We can’t wait for you to try it out and hear your thoughts.

Features

  • UI/UX
    Brand new UI that's faster, slicker and more enjoyable to use
  • SDKs
    Support tracing Bedrock models
  • SDKs
    Support tracing OpenAI Agents
  • SDKs
    Support tracing Pydantic AI systems
  • SDKs
    Support tracing LangGraph systems
  • Security
    New "Member restricted" role, which can perform member actions without viewing data source data
  • Integrations
    Directly connect Snowflake tables to projects
  • UI/UX
    View project, datasets and table dropdowns when connecting BigQuery tables
  • Platform
    Allow hosting Openlayer on subpaths in on-prem deployments
  • Platform
    Allow users to override LLM costs with custom costs
  • Evals
    Include standard deviation score in LLM-as-a-judge and Ragas test results
  • Evals
    New prompt injection test to detect adversarial attacks on LLM systems

Improvements

  • Platform
    Rename "inference pipelines" to "data sources" to capture broader scope
  • Platform
    Better skipped test messages for metrics that require ground truths
  • API
    Speed up endpoints that return record counts and last record date for data sources
  • Evals
    Show per-row scores for metrics like semantic similarity, exact match in data tables

Fixes

  • Evals
    Tests that use both historical data and auto thresholds were erroring
  • API
    Speed up data source creation request
  • Platform
    Re-run tests that are stuck in running state
  • API
    Allow streaming data with numpy arrays in the body

The Openlayer MCP server, Automatic thresholds, BigQuery Integration and Anomaly Detection, Project-level access groups

The Openlayer MCP server, Automatic thresholds, BigQuery Integration and Anomaly Detection, Project-level access groups

We’re introducing an exciting new feature to our observability platform: automatic thresholds for tests and anomaly detection.

Openlayer now supports automatic thresholds for tests, which are data-driven and adapt to your AI system over time. Whether you're monitoring cost, data quality, or GPT eval scores, we'll suggest thresholds based on historical patterns to take the guesswork out of defining acceptable criteria for your system.

We’ve also introduced anomaly detection to flag test results that deviate from the norm. This means you’ll get alerted when something’s off based on the automatic thresholds that we predict.

Both features are designed to take the pain out of manual setup and make your evaluations more proactive and intelligent. To get started, just create a new test in the Openlayer app and choose automatic when setting the threshold.

Features

  • MCP
    Release the Openlayer MCP server so users can use Openlayer tests in IDE workflows
  • SDKs
    Add OpenLIT integration notebook
  • SDKs
    Add a convenience function that copies tests from one project to another
  • SDKs
    Add an option to wait for commit completion to push function
  • SDKs
    Add async OpenAI tracer
  • API
    Support creating tests from the API
  • Evals
    Support for automatic thresholds
  • UI/UX
    Daily feature distribution graphs for tabular data projects
  • Evals
    Add a column statistic test that supports mean, median, min, max, std, sum, count and variance
  • Evals
    Add a raw SQL query test
  • Integrations
    Add support for directly integrating a project with BigQuery tables for continuous data quality monitoring
  • Evals
    Add an anomalous column detection test
  • Platform
    Add root cause analysis and segment distribution graphs to various tests’ diagnostic page
  • Evals
    Add support for Gemini 2.0 models for LLM-as-a-judge tests
  • Platform
    Add a priority property to tests (critical, high, medium, low)
  • Platform
    Include or exclude inference pipelines when creating tests in a project
  • Platform
    Add record count, last record received date to inference pipeline
  • Evals
    Support running monitoring mode tests on the entire history of data rather than moving windows
  • Platform
    On-premise deployment guides for OpenShift, AWS EKS
  • Security
    Permissions at a project-level through access groups

Improvements

  • Platform
    Immediately execute tests in monitoring mode
  • Platform
    Parse OpenTelemetry traces from Semantic Kernel, Spring AI
  • Platform
    Test failures will not cause the commit’s status to fail
  • Evals
    LLM-as-a-judge base prompt tweaks to improve consistency

Fixes

  • UI/UX
    Broken link in connected Git repo settings
  • Evals
    Increase LLM-as-a-judge criteria character limit
  • UI/UX
    Enable sorting data tables by booleans
  • Platform
    Surface OpenAI refusals to user in LLM-as-a-judge tests
  • Platform
    Add a notification when batch data uploads fail

Project-level secrets, tracing LLM requests with OpenTelemetry

Project-level secrets, tracing LLM requests with OpenTelemetry

We’ve shipped new ways to manage secrets and API keys across your Openlayer projects, making it easier to scale and stay secure.

Now, you can add project-level secrets directly from the Platform. This means API keys, auth tokens, and other sensitive values can be securely stored and referenced across your tests without needing to duplicate them or hardcode anything.

For our on-premise users, you can now set default API keys for LLM-as-a-judge across your entire deployment. No need to configure keys for every individual workspace or project, just set once and go.

Features

  • SDKs
    Add endpoint to retrieve commit by ID
  • Templates
    Add default test cases and metrics to various LLM projects in templates repo
  • API
    Add workspace creation/retrieval, API key creation, and member invitation endpoints
  • API
    Add `/versions/{id}` endpoint to the public API
  • Evals
    Add JSON schema validation test
  • Evals
    Support Azure OpenAI deployments for LLM-as-a-judge tests
  • Platform
    Support project-level secrets
  • Evals
    Add gpt-4o-mini to the LLM evaluator
  • Platform
    Set default API keys for LLM-as-a-judge for an entire on-prem deployment
  • SDKs
    Add support for tracing with OpenTelemetry
  • Platform
    Search, sort and filter inference pipelines in the UI and via the API

Fixes

  • UI/UX
    Render status message in commit details
  • Integrations
    Handle GitHub commit with empty username
  • Evals
    Issue with creating feature value tests

SAML Directory Sync, new LLM-as-a-judge models, and website refresh

SAML Directory Sync, new LLM-as-a-judge models, and website refresh

We’ve added lots of features and enhancements across our platform, focused on improving performance, expanding functionality, and streamlining workflows. To highlight a few:

🔐 Increased security with SAML SSO directory sync. You can now sync SAML SSO on Openlayer with existing security groups. Openlayer can now more seamlessly fit into your organization’s security policies.

🧑‍⚖️ New LLM-as-a-judge models. We’ve expanded the models available to act as judges for LLM-as-a-judge tests. You can now use models from Cohere and Vertex AI when running these tests.

🎨 Website refresh. We’ve given our website a brand refresh, including lots of fun animations showcasing the Openlayer product in action and case studies from some of our customers.

Features

  • SDKs
    Faster batch uploads with pyarrow support
  • SDKs
    Push commits to the platform via the Python SDK
  • UI/UX
    Tabular view of test results in test modals
  • UI/UX
    Add pie graph for test results in project home
  • Evals
    Add Faithfulness and Answer Correctness metrics for RAG systems
  • Platform
    Use Cohere, Vertex AI models as options for LLM-as-a-judge metrics
  • API
    Add `expand` to inference pipeline GETs so projects and workspaces are included in the response body
  • Platform
    New "Viewer" role in workspaces that doesn’t have write, update or delete permissions on resources
  • SDKs
    Support for async data uploads, and faster upload speeds
  • Platform
    Directory sync with SAML

Improvements

  • API
    Lower latency for data stream endpoint
  • UI/UX
    Update tooltips and rendering of statuses in test cards
  • UI/UX
    Make sections in test modals collapsible
  • API
    Add skipped and failing test counts in project version and inference pipeline objects
  • API
    Better error messages for invalid data configs when streaming data
  • Platform
    More intuitive status messages for skipped tests
  • Documentation
    Add code samples in Java

Fixes

  • Platform
    Generate outputs step was not failing gracefully
  • UI/UX
    Surface user-facing error messages upon SSO login failures
  • UI/UX
    Better failure message when password reset link has expired
  • Platform
    Improved rate limiting
  • Integrations
    Slack notifications for create pipeline now includes name
  • Platform
    Answer Correctness metric was breaking when output was not a string

Improved test diagnosis page, SAML SSO, design refreshes, + more

Improved test diagnosis page, SAML SSO, design refreshes, + more

🔎🩹 Quickly identify issues with the improved test diagnosis page Diagnosing issues is a core part of the eval process, and that’s why we want to make sure our test diagnosis page is as helpful as possible. To make it easier to figure out why a test has been skipped or errored, we’ve added a list view where you can easily scan through test results and view any related error messages. We’ve added an overview so you can see the test result breakdown at a glance, as well as recent issues and failures. We’ve also made each section of the page collapsible for a smoother experience.

🔐 Make your login even more secure by enabling SAML SSO We now support SAML SSO using any of the major providers so that you can make sure your team’s workspace has that extra layer of security.

Features

  • Collaboration
    SAML SSO Support
  • Platform
    List view for results on test diagnosis page (error messages for skipped and errored tests are now visible, ability to filter test results by type, test results overview at the top of the page which lists the total number of results for each status type and recent issues with the test results)

Improvements

  • Documentation
    Groq guide available in docs
  • Integrations
    Support for Azure OpenAI as an LLM evaluator
  • UI/UX
    Login page design refresh
  • UI/UX
    Sections in test diagnosis page are collapsible
  • UI/UX
    More informative tooltips on test cards
  • UI/UX
    Homepage overview polishes
  • Evals
    Additional Ragas metrics (faithfulness, answer correctness)
  • Observability
    Updated cost table for OpenAI models
  • UI/UX
    Notifications for new inference pipelines now list the name of the pipeline

Custom metrics, rotating API keys, and new models for direct-to-API calls

Custom metrics, rotating API keys, and new models for direct-to-API calls

We understand that you may have metrics that are highly specific to your use case, and you want to use these alongside standard metrics to eval your AI systems. That’s why we built custom metrics. You can now upload any custom metric to Openlayer simply by specifying them in your openlayer.json file. These metrics can then be used in a number of ways on platform; they’ll show up as metric tests that you can run, or as project-wide metrics that will be computed on all of your data. Now, your evals on Openlayer are more comprehensive than ever.

We’ve shipped more exciting features and improvements this month, including the ability to create multiple API keys, and a bunch of new models available for direct-to-API calls, so be sure to read below for a full list of updates!

Features

  • Evals
    Custom metrics (Upload your own custom metrics to Openlayer, which can be used: as project-wide metrics, as tests)
  • API
    Create multiple Openlayer API keys (create new personal Openlayer API keys so that you can rotate API keys, rename and delete keys)
  • API
    Specify desired metrics in openlayer.json
  • API
    New models available for direct-to-API calls (GPT-4o, GPT-4 Turbo, Claude 3.5 Sonnet, Claude 3 Haiku, Claude 3 Opus, Claude 3 Sonnet, Command R, Command R Plus, Gemini 1.0 Flash, Gemini 1.5 Flash, Gemini 1.5 Pro

Improvements

  • UI/UX
    Test creation page design improvements
  • Integrations
    Link to git repository and organization in git settings pages
  • UI/UX
    Add button to view status of commit during processing in project loading state
  • UI/UX
    Updated solid danger buttons’ shade of red
  • UI/UX
    Modal background overlay opacity is no longer too light
  • UI/UX
    Toast messages no longer overflow the page
  • UI/UX
    Improved text sizing in various places
  • UI/UX
    Added error toast when Assistant requests fail
  • UI/UX
    Navigation polish
  • UI/UX
    Different icons for different commit sources
  • UI/UX
    Suggested titles for GPT evaluation tests now reference the criteria name
  • SDKs
    Improvements to docs (updated Python code snippets with the new SDK syntax, tracing for Anthropic models, updated example notebook links)

Fixes

  • UI/UX
    Commit log processing time does not use relative time
  • Collaboration
    New users that were invited to a workspace do not auto-navigate to invites page
  • UI/UX
    Help breadcrumb is hidden and shows in place of user dropdown options
  • UI/UX
    Cost values close to 0 rendered as $0.00
  • UI/UX
    Progress bars did not render in chrome
  • UI/UX
    Test metadata disappeared entirely when collapsed
  • UI/UX
    Navigating to project from breadcrumb prevents back navigation
  • UI/UX
    Switching projects prevented back navigation
  • UI/UX
    Creating commit from the UI does not generate outputs
  • UI/UX
    Commit processing icon was broken in navigation dropdowns
  • UI/UX
    Activity log overflows screen

Improved quality control over your LLM’s responses with annotations and human feedback

Improved quality control over your LLM’s responses with annotations and human feedback

Setting up alerts is an essential first step to monitoring your LLMs, but in order to understand why issues arise in production, it’s helpful to have human eyes to review requests.

This process is now easier than ever in Openlayer - you can add annotations to any requests, with custom values. If you’ve set up tracing, you can annotate each individual step of the trace for more granularity.

Every request can also be rated as a thumbs up or thumbs down, making it easy to scan through good and bad responses and figure out where your model is going wrong.

We’ve released some other huge features and improvements this month, so make sure to read the full changelog below!

Features

  • UI/UX
    Ability to export data from the UI (Now you can download requests data right from the workspace. This is especially helpful if you’ve applied filters and want to download the filtered cohort of data)
  • UI/UX
    Updated navigation (Our navigation has a new layout featuring breadcrumbs at the top, making it much easier to navigate between projects and understand the hierarchy)
  • UI/UX
    Annotation and human feedback (You can now annotate any request with custom values. You can also give every request a thumbs up or thumbs down to make identifying error patterns even easier)

Improvements

  • Templates
    More project templates
  • SDKs
    Improved OpenAI SDK
  • UI/UX
    Improvements to billing page in settings
  • Integrations
    Project-level Git repository settings now available
  • Integrations
    Ability to now edit branch and root directory in project-level git settings
  • UI/UX
    With new navigation, ability to copy project name and inference pipeline ID
  • UI/UX
    Ability to add ground truths to requests and edit existing ground truths
  • UI/UX
    Data in individual test modals is now filtered by selected evaluation window

Fixes

  • Performance
    Some tests were improperly skipped
  • UI/UX
    Openlayer Assistant was broken
  • Security
    Spaces in No PII test caused errors
  • Performance
    Issue with metric tests when input variable names were null
  • UI/UX
    Hovering over graph with no results shows broken tooltip

Simple, dev-focused workflow for AI evals

 Simple, dev-focused workflow for AI evals

Most of us get how crucial AI evals are now. The thing is, almost all the eval platforms we’ve seen are clunky – there’s too much manual setup and adaptation needed, which breaks developers’ workflows.

Last week, we released a radically simpler workflow.

You can now connect your GitHub repo to Openlayer, and every commit on GitHub will also commit to Openlayer, triggering your tests. You now have continuous evaluation without extra effort.

You can customize the workflow using our CLI and REST API. We also offer template repositories around common use cases to get you started quickly.

You can leverage the same setup to monitor your live AI systems after you deploy them. It’s just a matter of setting some variables, and your Openlayer tests will run on top of your live data and send alerts if they start failing.

We’re very excited for you to try out this new workflow, and as always, we’re here to help and all feedback is welcome.

Features

  • Integrations
    Developer workflow (GitHub integration, CLI and REST API, Sample repositories for various workflows, Ability to clone sample repositories in Openlayer UI)
  • Evals
    New test: column A grouped by column B

Improvements

  • UI/UX
    Move test options to header bar in modals
  • UI/UX
    Improvements to test results modals
  • UI/UX
    Improve layout of workspace onboarding
  • UI/UX
    Ability to delete tests
  • Evals
    Relevant tests created automatically upon project creation in onboarding
  • UI/UX
    Polished design of in-app callouts
  • UI/UX
    Polish to activity log
  • Documentation
    Reorganization of docs
  • API
    Allow None values in token column

Fixes

  • UI/UX
    Row outputs in panel are injected into chat history format when they should not be
  • UI/UX
    Row panel dropdowns do not appear when opened from a test modal
  • UI/UX
    Monitoring graphs showed no recent results even when there were some
  • UI/UX
    Opening create test modal for Group by Column test crashed the app
  • UI/UX
    Column parameters was not able to be changed for Group By tests
  • Platform
    Creating a commit without a model breaks
  • UI/UX
    Project filtering did not work in overview page
  • UI/UX
    Creating Character Length tests runs into client-side error when there are no input variables
  • UI/UX
    Client-side exception when opening requests

Trace every step of your requests

Trace every step of your requests

We’re thrilled to share with you the latest update to Openlayer: comprehensive tracing capabilities and enhanced request streaming with function calling support.

Now, you can trace every step of a request to gain detailed insights in Openlayer. This granular view helps you to debug and optimize performance.

Additionally, we’ve expanded our request streaming capabilities to include support for function calling. This means that requests you stream to Openlayer are no longer a black box, giving you improved control and flexibility.

Features

  • Observability
    Tracing (Trace every step of a request and view details, including latency and fun, Support for function calling in request streaming)ction inputs & outputs, in the UI,
  • Integrations
    Added support for using Azure OpenAI models

Improvements

  • Performance
    Improved performance of the UI, including several networking optimizations
  • UI/UX
    Toggle button color improvements to make it easier to understand which is selected
  • UI/UX
    Improvement to color of background behind modals
  • UI/UX
    Column A mean / sum etc. grouped by column B values
  • UI/UX
    Surface generated question for answer relevancy metric
  • UI/UX
    Easily duplicate/fork test configurations
  • UI/UX
    Enable creating more tests without dismissing modal
  • UI/UX
    Improved design of request panel
  • UI/UX
    Warning displays in request pane when no prompt has been added
  • Project dashboard
    Request panel can be closed with the Esc key
  • UI/UX
    Navigate through requests in the panel by using the arrow keys
  • UI/UX
    Improved design of prompt roles in prompt blocks
  • UI/UX
    Ability to copy values of blocks and columns in request page
  • Templates
    RAG tracing example added to Openlayer examples gallery
  • Templates
    Azure GPT example added to Openlayer examples gallery
  • Performance
    Performance improvement: only automatically load inference pipelines and project versions if the user is in the relevant mode
  • UI/UX
    Remove Intercom app which was not utilized and was blocking core UI components
  • UI/UX
    Navigation callout components now have dark-mode purple styling
  • UI/UX
    Update notification page titles in settings
  • UI/UX
    Improvements and bug fixes for rendering content and metadata in selected row pane
  • UI/UX
    Updated copy icon
  • UI/UX
    Updated inconsistent delete icons throughout the app
  • UI/UX
    Render inputs in row panel even when no prompt is available
  • UI/UX
    Render metric scores and explanation columns further left in tables so they are in view without scrolling
  • UI/UX
    Updated format of date strings
  • UI/UX
    Enabled ability to collapse sections in row panels
  • UI/UX
    Enabled ability to collapse chat history blocks

Fixes

  • Templates
    In-app Google Colab links were incorrect
  • UI/UX
    Checkboxes for suggested tests were not default selected
  • UI/UX
    Graph in test modal rendered too short sometimes
  • UI/UX
    Prompt roles did not render correctly when set to an unknown value
  • API
    Handle cases where data contains non-utf8 codes
  • UI/UX
    Create test pages overflow before enabling scroll
  • UI/UX
    Test modal overflows page
  • UI/UX
    Boolean values would not render in request pane metadata
  • UI/UX
    Labels in request pane overflowed improperly with long content
  • UI/UX
    Tests rendered broken graphs when all results were skipped
  • Platform
    Inference pipelines did not automatically load
  • Platform
    Inference pipelines did not automatically update tests or requests
  • Platform
    Commits did not automatically load nor update tests once processed
  • API
    Projects did not automatically appear when added from API
  • SDKs
    API key and project name were not auto-filling in TypeScript code snippet for starting monitoring
  • UI/UX
    Clicking to browse a commit always went to monitoring mode
  • UI/UX
    Monitoring test graphs did not show hovered results on initial load until refreshing
  • UI/UX
    Opening requests page showed no data until refreshed
  • Platform
    Column drift test wouldn’t run on non-feature columns
  • UI/UX
    Timeline page showed monitoring tests
  • UI/UX
    Checkboxes for suggested tests did not check properly on click
  • UI/UX
    Multiple copies of tests got created on successive clicks
  • UI/UX
    Unselected tests got created, and not all selected tests got created
  • Performance
    Tests loaded for too long when skipped or unavailable
  • UI/UX
    Copy button rendered twice in code labels
  • UI/UX
    Chat history input in row panels sometimes showed text editor

More tests around latency metrics

More tests around latency metrics

We’ve added more ways to test latency. Beyond just mean, max, and total, you can now make test latency with minimum, median, 90th percentile, and 99th percentile metrics. Just head over to the Performance page and the new test types are there.

You can also create more granular data tests by applying subpopulation filters to run the tests on specific clusters of your data. Just add filters in the Data Integrity or Data Consistency pages, and the subpopulation will be applied.

Features

  • Evals
    Ability to apply subpopulation filters to data tests (Min Latenc, Median Latency, 90th Percentile Latency, 95th Percentile Latency, 99th Percentile Latency)
  • SDKs
    Support for logging and testing runs of the OpenAI Assistants API with our Python and TypeScript clients

Improvements

  • API
    Updated OpenAI model pricing
  • Templates
    Support for OpenAI assistants with example notebook
  • Performance
    Improved performance for monitoring projects
  • UI/UX
    Requests are updated every 5 seconds live on the page
  • UI/UX
    Ability to search projects by name in the project overview
  • UI/UX
    You can now view rows per evaluation window in test modals
  • UI/UX
    Date picker for selecting data range in test modal
  • UI/UX
    Show only the failing rows for tests
  • UI/UX
    Allow opening rows to the side in test modal tables
  • UI/UX
    Enable collapsing the metadata pane in test modals
  • UI/UX
    Skipped test results now render the value from the last successful evaluation in monitoring

Fixes

  • Integrations
    Langchain version bug is fixed
  • UI/UX
    Metric score and explanations did not appear in data tables in development mode
  • UI/UX
    Request table layout was broken
  • UI/UX
    Now able to navigate to subsequent pages in requests page
  • UI/UX
    Fixed bug with opening request metadata
  • Performance
    Requests and inference pipeline occasionally did not load
  • Performance
    Some LLM metrics had null scores in development mode
  • UI/UX
    There was a redundant navigation tab bar in monitoring test modals
  • Performance
    Monitoring tests with no results loaded infinitely

Go deep on test result history and add multiple criteria to GPT evaluation tests

Go deep on test result history and add multiple criteria to GPT evaluation tests

You can now click on any test to dive deep into the test result history. Select specific date ranges to see the requests from that time period, scrub through the graph to spot patterns over time, and get a full picture of performance.

We’ve also added the ability to add multiple criteria to GPT evaluation tests. Let’s say you’re using an LLM to parse customer support tickets and want to make sure every output contains the correct name, email address and account ID for the customer. You can now set a unique threshold for each of these criteria in one test.

Features

  • UI/UX
    Scrub through the entire history of test results in the individual test pages (See which requests were evaluated per each evaluation window, See results and requests from a specific time period)
  • Evals
    Improved LLM-as-a-judge test (Add multiple criteria to a single test, Choose how you want each row to be scored against the criteria: on a range from 0-1, or a binary 0 or 1)

Improvements

  • Performance
    Bolster backend server to handle higher loads
  • UI/UX
    Table headers no longer wrap
  • UI/UX
    Null columns hidden in data table
  • UI/UX
    Test metadata moved to the side panel so that the test results graph and data are viewed more easily
  • UI/UX
    Skipped test results are rendered with the most recent result value
  • UI/UX
    Test results graph height increased in the page for an individual test
  • UI/UX
    Date labels in tests results graph improved
  • Performance
    Only render rows that were evaluated for GPT metric threshold tests
  • UI/UX
    Test card graphs no longer fla

Fixes

  • UI/UX
    Results graph was not sorted correctly
  • UI/UX
    Test results graph did not overflow properly
  • UI/UX
    Test results graph did not render all data points
  • Platform
    Empty and quasi-constant features test creation was broken
  • UI/UX
    Undefined column values now rendered as null
  • UI/UX
    Most recent rows were not being shown by default
  • UI/UX
    Label chip in results graphs for string validation tests was not inline
  • UI/UX
    Test results were not rendering properly in development mode
  • UI/UX
    Plan name label overflowed navigation
  • UI/UX
    Buttons for exploring subpopulations was active even when no subpopulations existed
  • UI/UX
    Results graph rendered loading indicator even after networking completed for skipped evaluations
  • UI/UX
    Rows for the current evaluation window were not rendered in test modals
  • UI/UX
    Commit, metrics, and other tables were not rendering rows
  • UI/UX
    Duplicate loading and empty placeholders rendered in monitoring mode

Cost-per-request, new tests, subpopulation support for data tests, and more precise row filtering

Cost-per-request, new tests, subpopulation support for data tests, and more precise row filtering

We’re excited to introduce the newest set of tests to hit Openlayer! Make sure column averages fall within a certain range with the Column average test. Ensure that your outputs contain specific keywords per request with our Column contains string test, where the values in Column B must contain the string values in Column A. Monitor and manage your costs by setting Max cost, Mean cost, and Total cost tests.

As additional support for managing costs, we now show you the cost of every request in the Requests page.

You can now filter data when creating integrity or consistency tests so that the results are calculated on specific subpopulations of your data, just like performance goals.

That’s not all, so make sure to read all the updates below. Join our Discord community to follow along on our development journey, and stay tuned for more updates from the changelog! 📩🤝

Features

  • Evals
    New tests (Column average test – make sure column averages fall within a range, Cost-related tests – max cost, mean cost, and total cost per evaluation window) Column contains string test – column B must contain the string in column A)
  • Platform
    View your production data associated with each of your tests in monitoring mode
  • Observability
    Support for cost-per-request and cost graph
  • Platform
    Filter rows by row-level metrics such as conciseness
  • Evals
    Subpopulation support for data goals
  • UI/UX
    The timeline page is back - see how your commits perform on goals over time

Improvements

  • Platform
    Ability to update previously published production data by setting existing columns or adding new columns
  • Performance
    Sample requests are paginated
  • Performance
    Latency rendered in ms in the requests table
  • UI/UX
    Requests filters no longer require selecting a filter type
  • UI/UX
    Suggested tests modal auto-opens after project creation outside of the onboarding
  • UI/UX
    Notifications callout not shown until the project is fully setup
  • UI/UX
    Enabled filtering without datasets in development and monitoring modes
  • Performance
    Render cost in requests table
  • Performance
    Render monitoring data correctly in test diagnosis modals
  • Evals
    Row-level scores and explanations rendered for gpt-based metric tests
  • UI/UX
    Activity log is now collapsible
  • UI/UX
    Individual rows in data tables within the test diagnosis modal can be expanded
  • UI/UX
    Input and output columns rendered next to each other in data tables
  • SDKs
    New example notebook showing how to send additional columns as metadata with the monitor
  • SDKs
    Cleaned up example notebooks

Fixes

  • UI/UX
    Irrelevant reserved columns no longer presented in requests table
  • UI/UX
    Column filtering did not dismiss in requests page
  • UI/UX
    Button to create commit from UI was rendered for non-LLM projects
  • Platform
    Navigating back from certain pages was broken
  • UI/UX
    Dismissing modals caused the app to become unresponsive
  • UI/UX
    Monitoring onboarding modal did not open
  • Performance
    Production tests with subpopulation filters rendered incorrect insights in results graph
  • UI/UX
    Clicking outside of dropdowns within a modal dismissed the whole modal
  • UI/UX
    Improved discoverability of the data points that a test is run on in test diagnosis modal
  • UI/UX
    Subsequent pages of monitoring requests would not always render
  • UI/UX
    Some rows contained latency, cost, and tokens columns even if they were left unspecified
  • UI/UX
    Suggested test modal reappeared unexpectedly
  • UI/UX
    When table columns are very large, other columns were not readable
  • UI/UX
    LLM rubric tests did not show score or explanations in monitoring
  • UI/UX
    Requests pane was not scrollable
  • UI/UX
    Some error states for test creation and results weren’t being shown
  • UI/UX
    Column Value test title was not updating upon threshold change
  • UI/UX
    Default color scheme to system
  • SDKs
    Added new and updated existing examples of how to incorporate the Openlayer TypeScript client for various use cases
  • UI/UX
    Data table columns no longer cut off

Log multi-turn interactions, sort and filter production requests, and token usage and latency graphs

Log multi-turn interactions, sort and filter production requests, and token usage and latency graphs

Introducing support for multi-turn interactions. You can now log and refer back to the full chat history of each of your production requests in Openlayer. Sort by timestamp, token usage, or latency to dig deeper into your AI’s usage. And view graphs of these metrics over time.

There’s more: we now support Google’s new Gemini model. Try out the new model and compare its performance against others.

⬇️ Read the full changelog below for all the tweaks and improvements we’ve shipped over the last few weeks and, as always, stay closer to our development journey by joining our Discord!

Features

  • Observability
    Log multi-turn interactions in monitoring mode, and inspect individual production requests to view the full chat history alongside other meta like token usage and latency
  • UI/UX
    Sort and filter through your production requests
  • Observability
    View a graph of the token usage and latency across all your requests over time
  • Integrations
    Support for Gemini is now available in-platform: experiment with Google’s new model and see how it performs on your tests
  • Evals
    View row-by-row explanations for tests using GPT evaluation

Improvements

  • SDKs
    Expanded the Openlayer TypeScript/JavaScript library to support all methods of logging requests, including those using other providers or workflows than OpenAI
  • UI/UX
    Improved commit selector shows the message and date published for each commit
  • UI/UX
    New notifications for uploading reference datasets and data limits exceeded in monitoring mode
  • Collaboration
    Only send email notifications when test statuses have changed from the previous evaluation in monitoring
  • Templates
    Added sample projects for monitoring
  • UI/UX
    Enhancements to the onboarding, including a way to quickstart a monitoring project by sending a sample request through the UI
  • UI/UX
    No longer navigate away from the current page when toggling between development and monitoring, unless the mode does not apply to the page
  • UI/UX
    Allow reading and setting project descriptions from the UI
  • UI/UX
    Update style of selected state for project mode toggles in the navigation panel for clarity
  • UI/UX
    Clarify that thresholds involving percentages currently require inputting floats
  • Platform
    Allow computing PPS tests for columns other than the features
  • UI/UX
    Test results automatically update without having to refresh the page in monitoring mode
  • UI/UX
    Add dates of last/next evaluation to monitoring projects and a loading indication when they recompute
  • UI/UX
    Surface error messages when tests fail to compute
  • UI/UX
    Add callouts for setting up notifications and viewing current usage against plan limits in the navigation
  • UI/UX
    Graphs with only a single data point have a clearer representation now
  • UI/UX
    Improvements to the experience of creating tests with lots of parameters/configuration
  • UI/UX
    Improvements to the experience of creating tests with lots of parameters/configuration
  • UI/UX
    Add alert when using Openlayer on mobile
  • UI/UX
    Default request volume, token usage, and latency graphs to monthly view

Fixes

  • UI/UX
    Title suggestions for certain tests during creation were unavailable or inaccurate
  • UI/UX
    Fixes to test parameters, including incorrectly labeled and invalid options
  • UI/UX
    Certain LLM tests would not allow selecting target columns that are not input variables
  • UI/UX
    Code in development onboarding modals was not syntax highlighted
  • UI/UX
    Create test card content would overflow improperly
  • UI/UX
    Sample projects would not show button for creating suggested tests after some were created
  • UI/UX
    Graphs in monitoring test cards were cut off
  • UI/UX
    Requests table would break when rows were missing columns
  • UI/UX
    Full-screen onboarding pages would not allow scrolling when overflowed
  • UI/UX
    Options were sometimes duplicated in heatmap dropdowns
  • UI/UX
    Thresholds would not faithfully appear in test result graphs
  • UI/UX
    Skipped evaluations would not appear in test result graphs

GPT evaluation, Great Expectations, real-time streaming, TypeScript support, and new docs

GPT evaluation, Great Expectations, real-time streaming, TypeScript support, and new docs

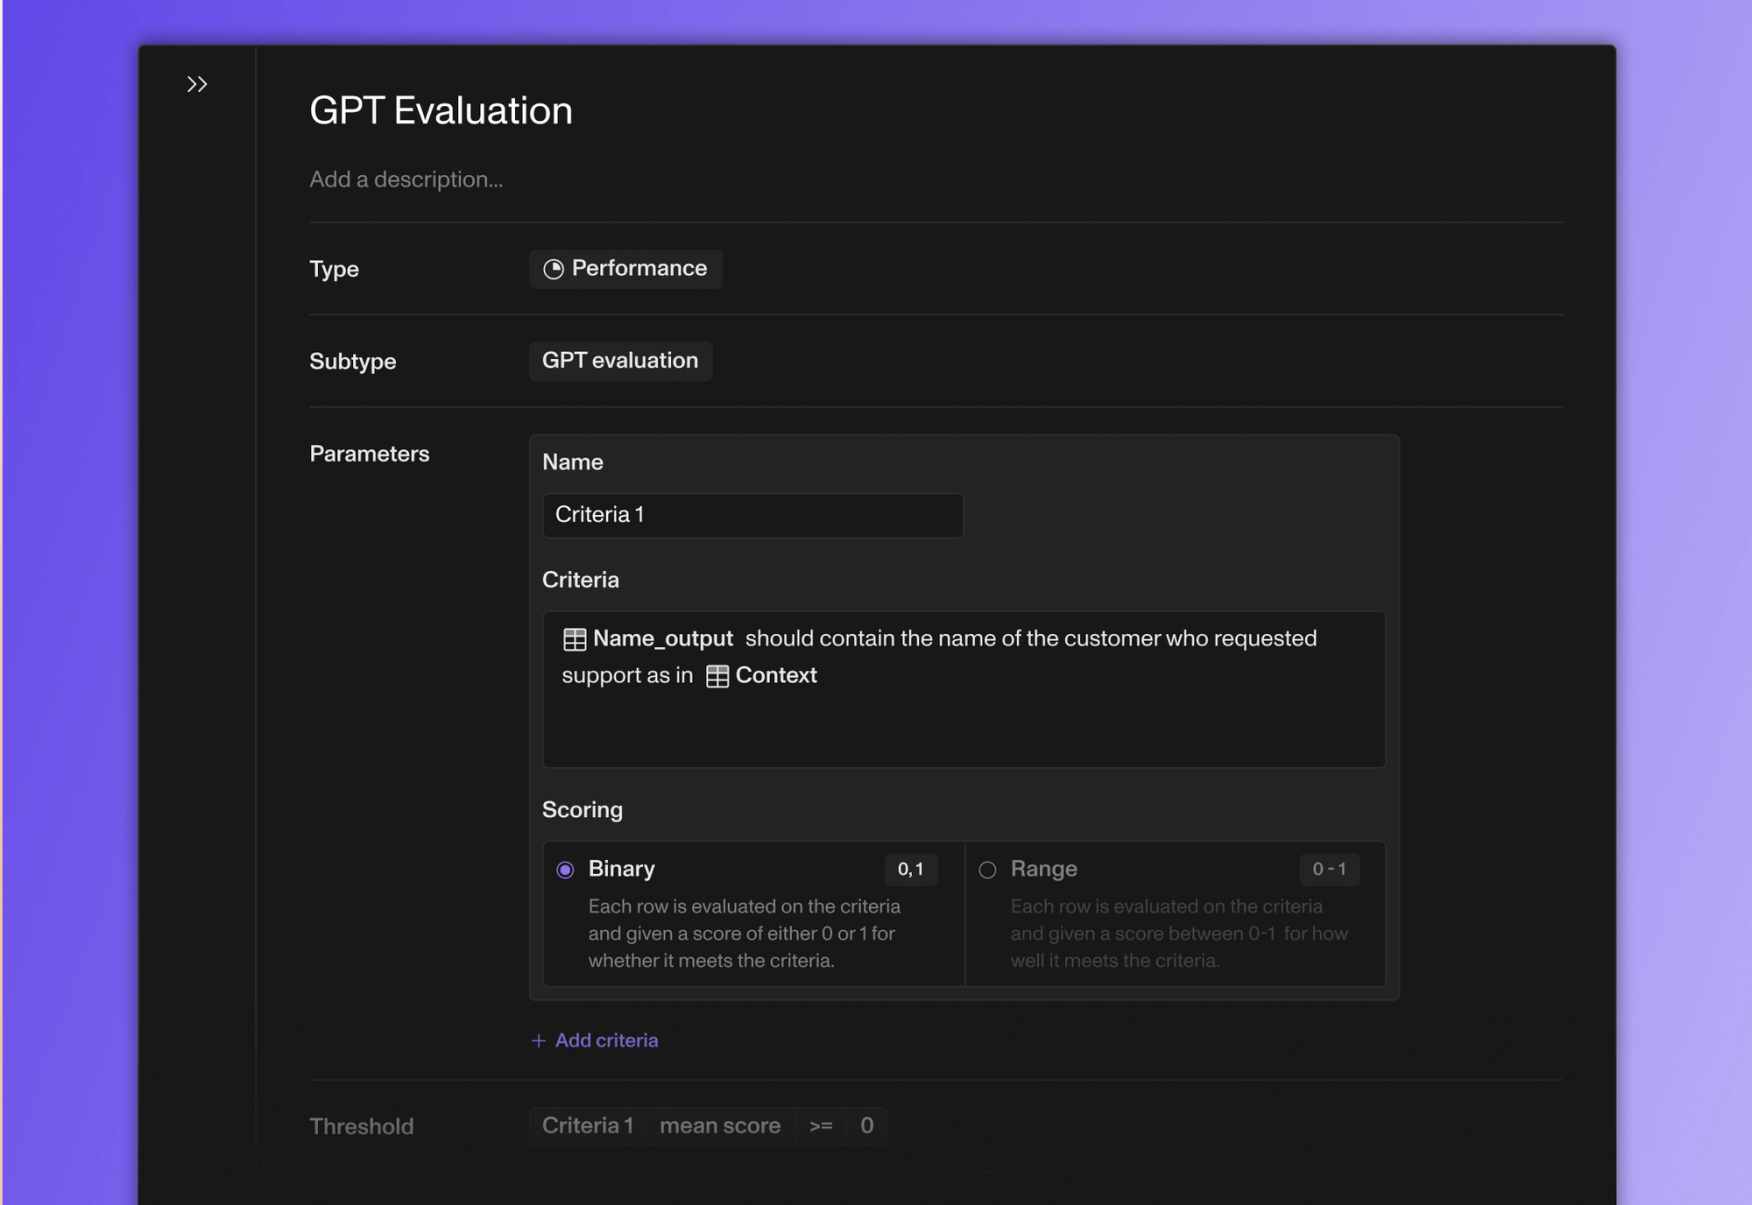
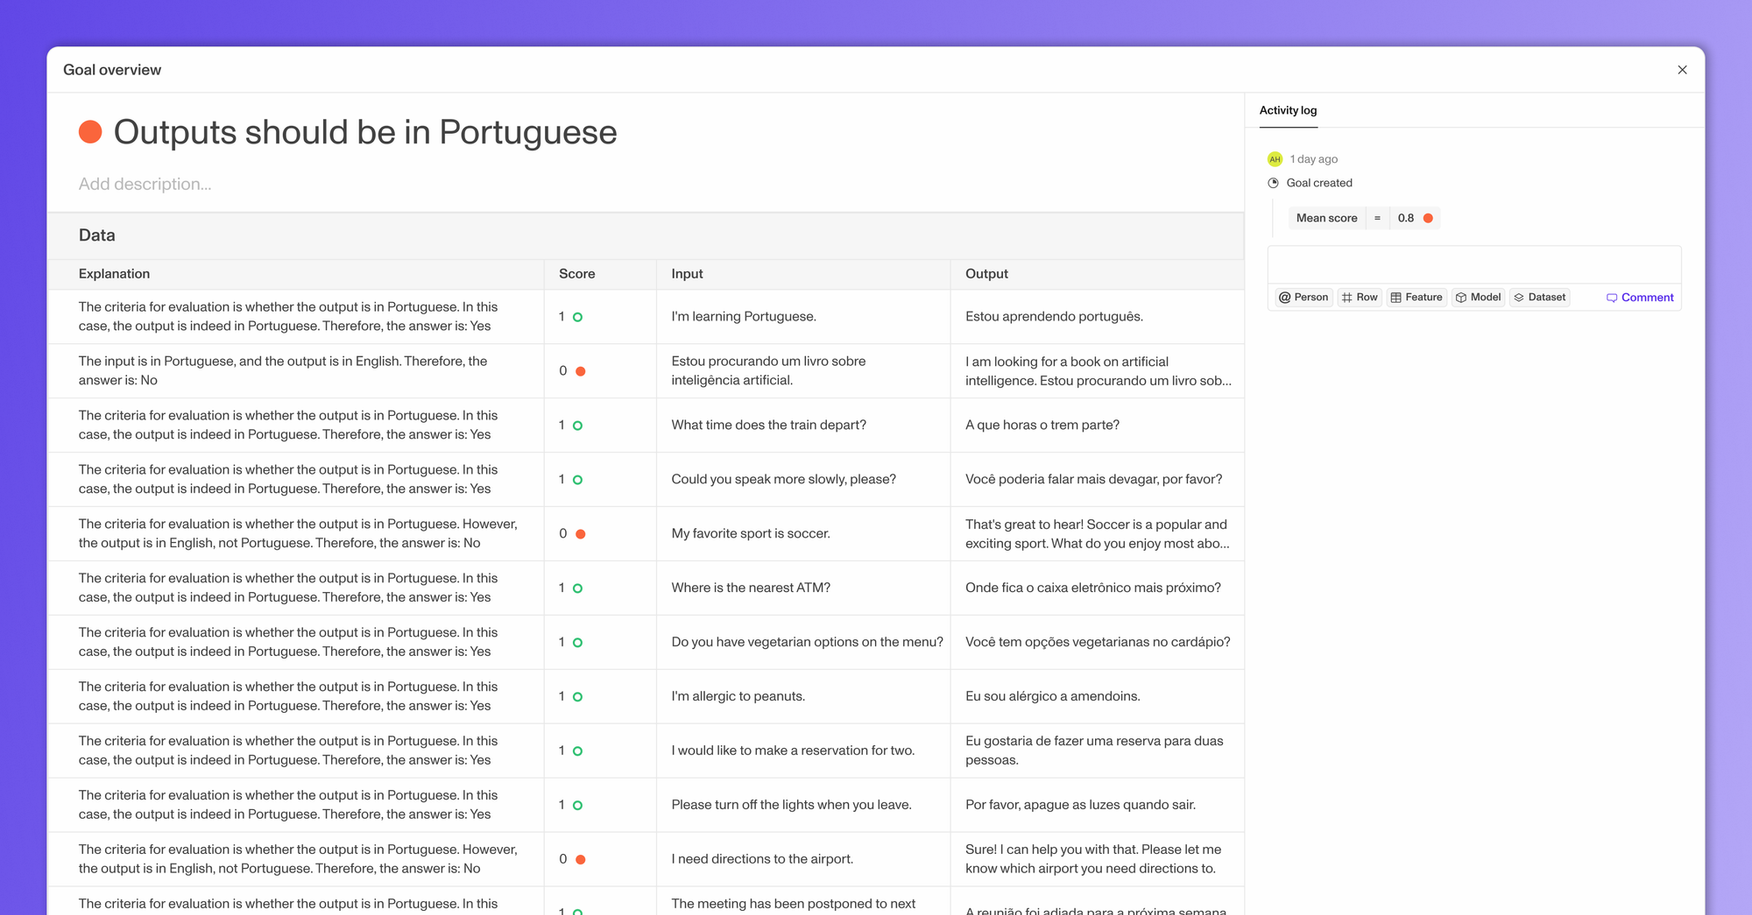
Openlayer now offers built-in GPT evaluation for your model outputs. You can write descriptive evaluations like “Make sure the outputs do not contain profanity,” and we will use an LLM to grade your agent or model given this criteria.

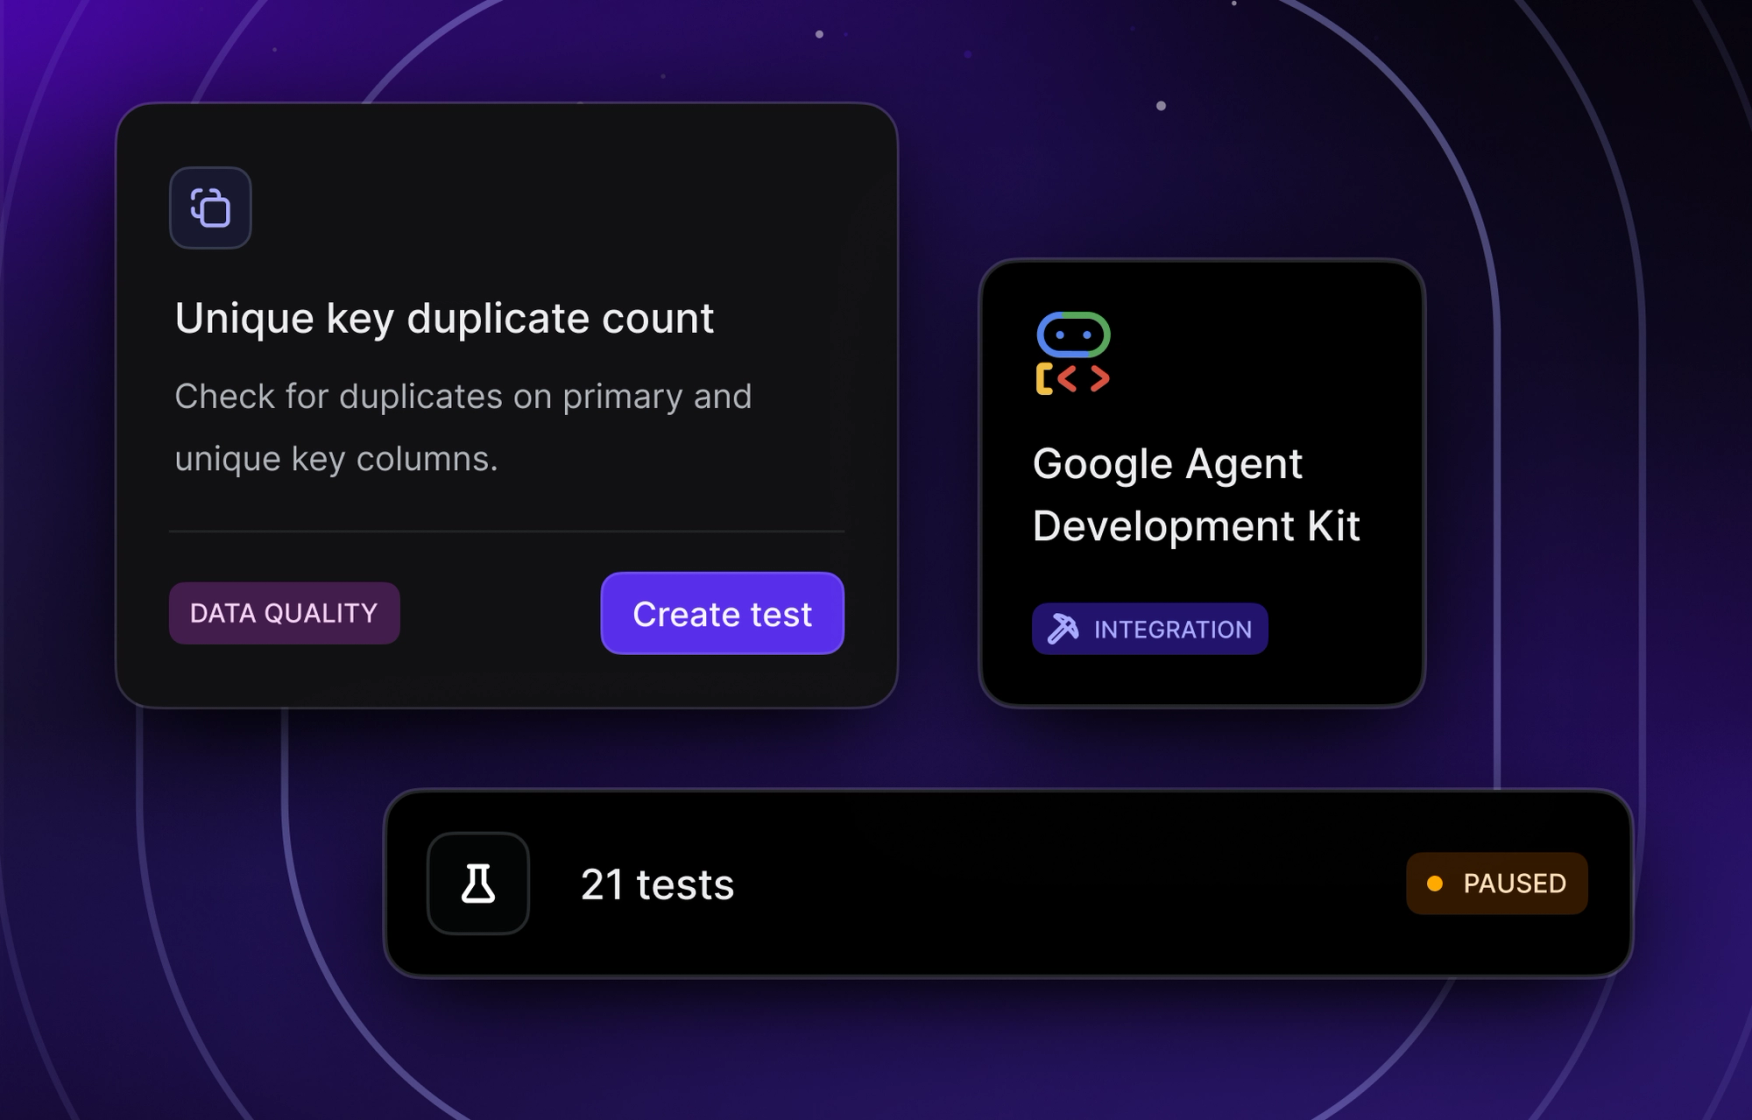
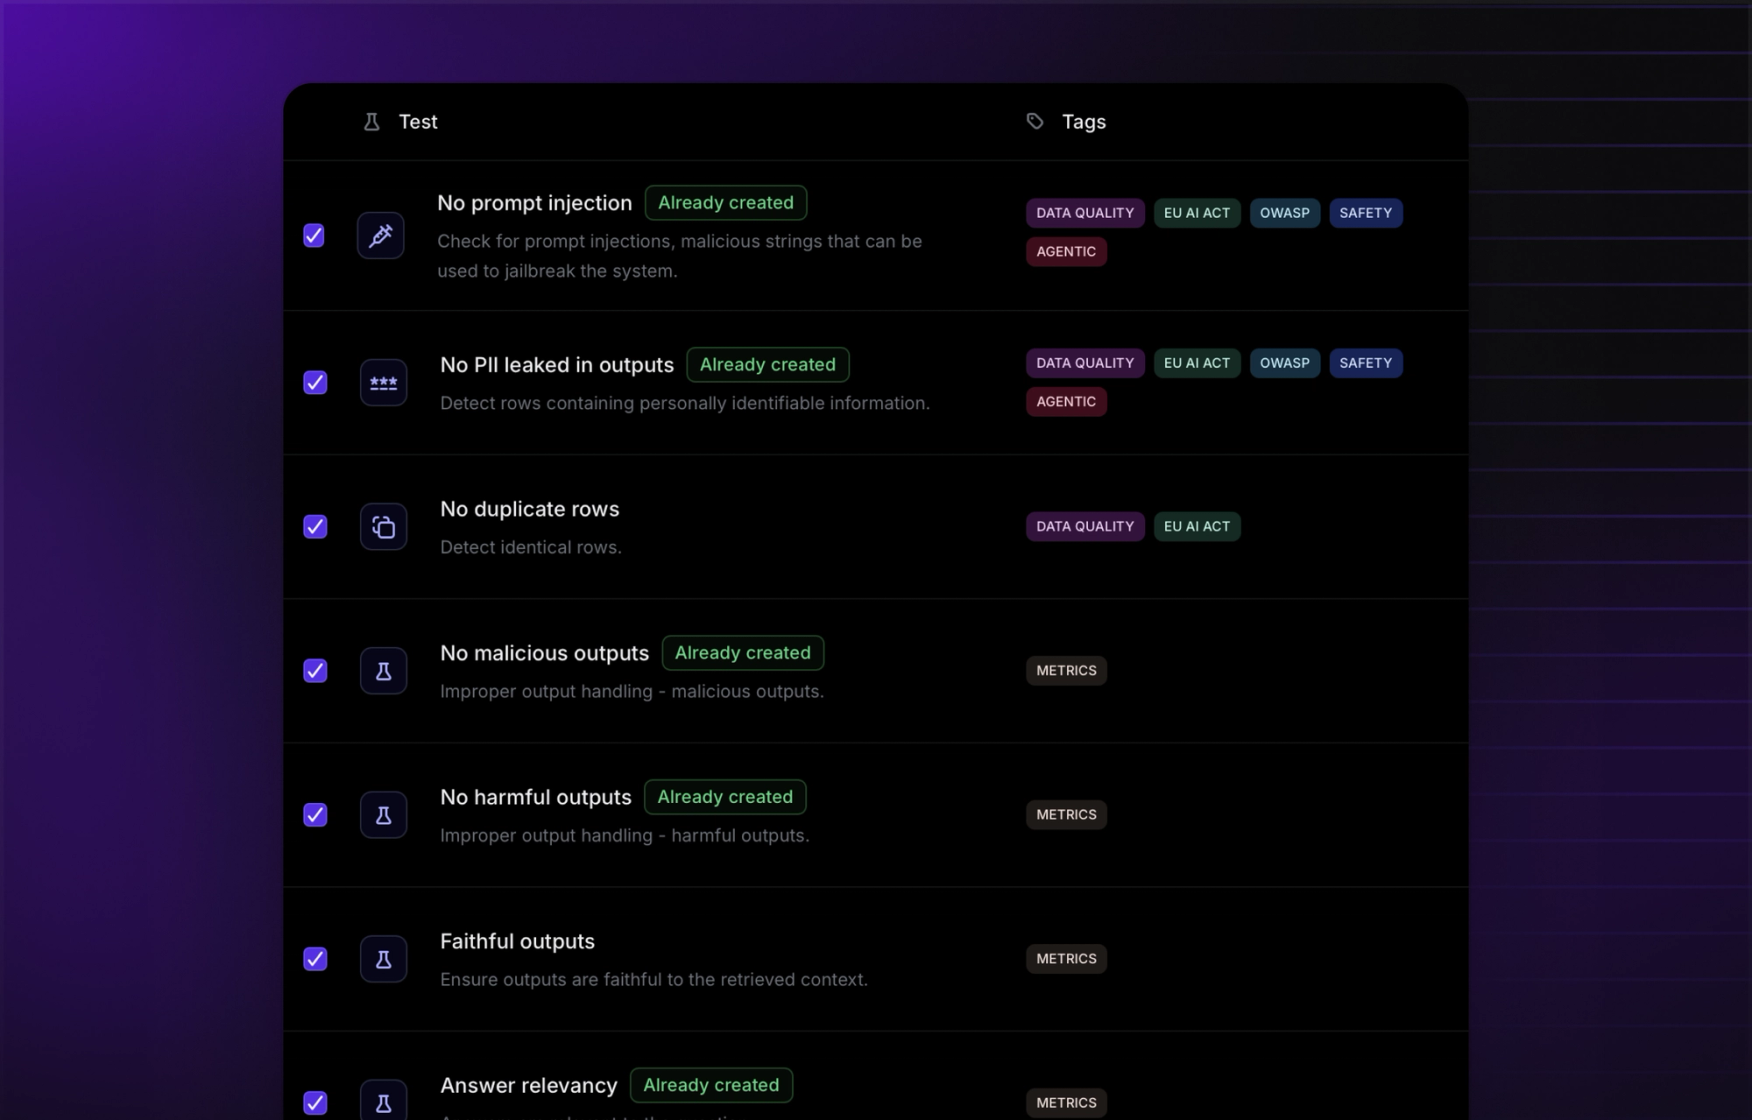
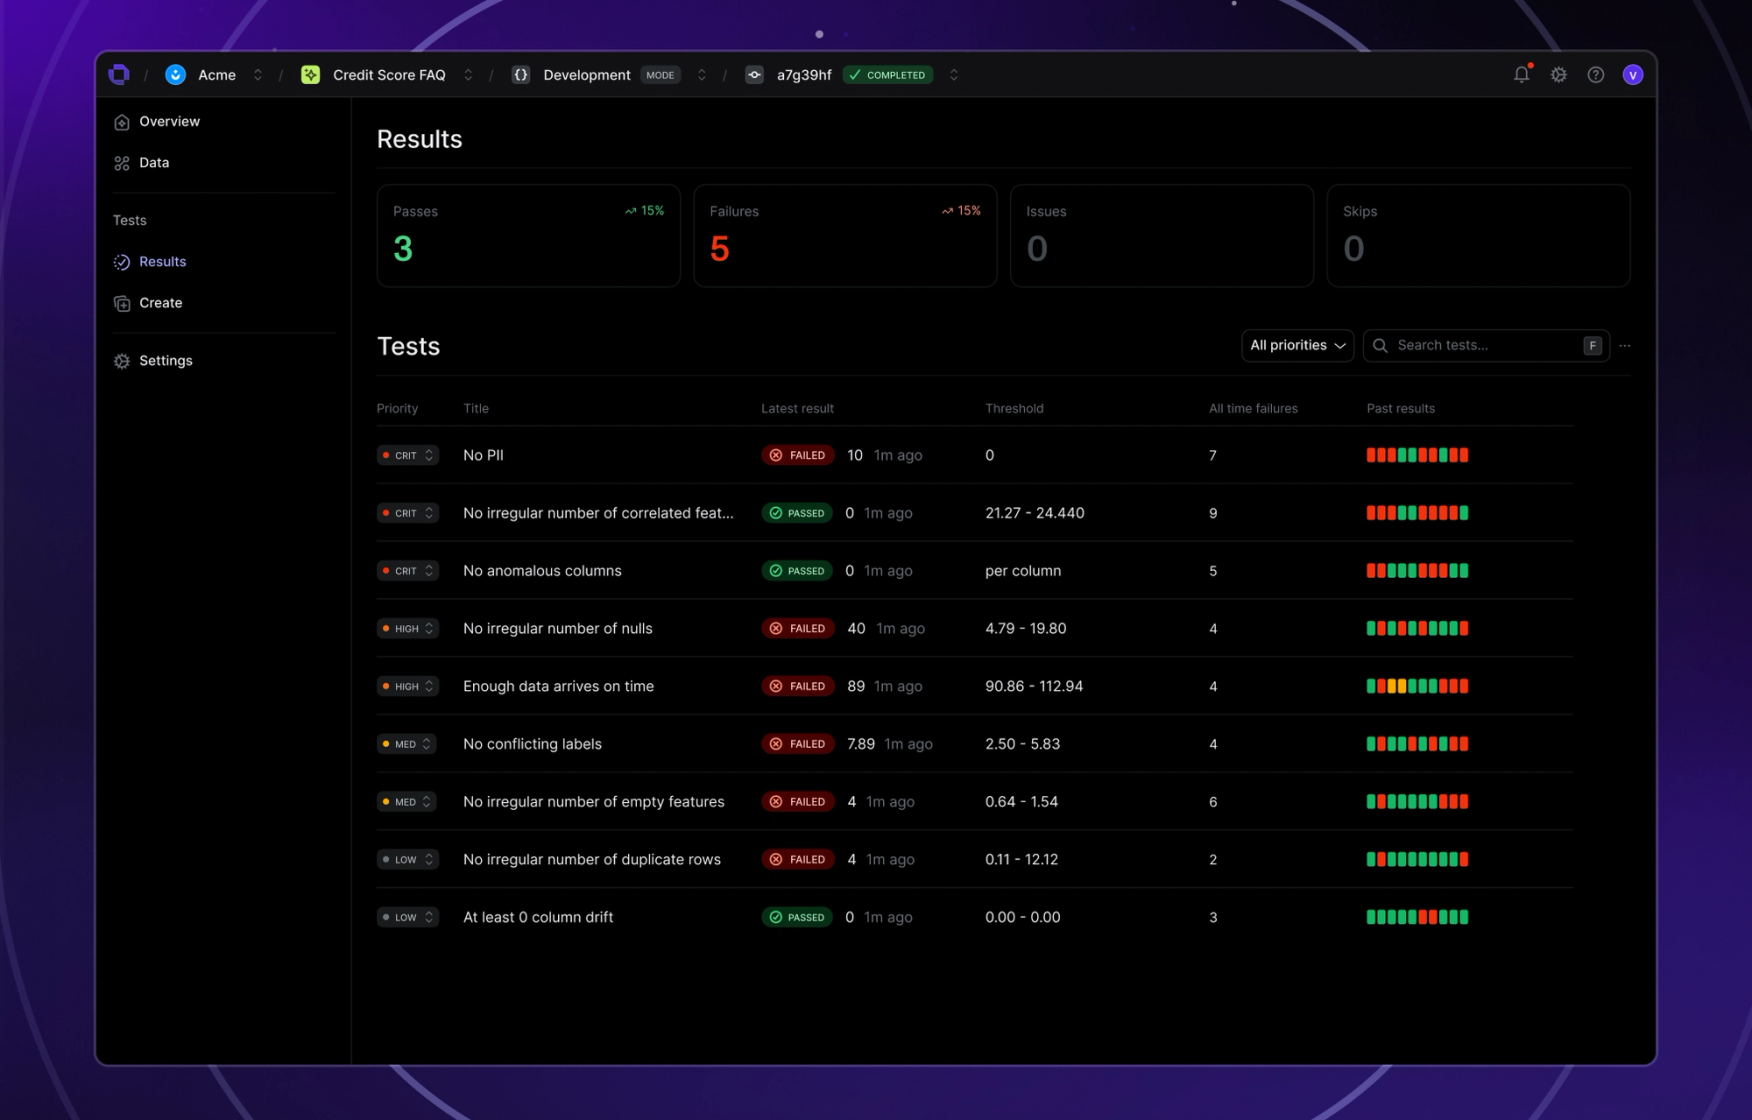
We also added support for creating and running tests from Great Expectations (GX). GX offers hundreds of unique tests on your data, which are now available in all your Openlayer projects. Besides these, there are many other new tests available across different project task types. View the full list below ⬇️

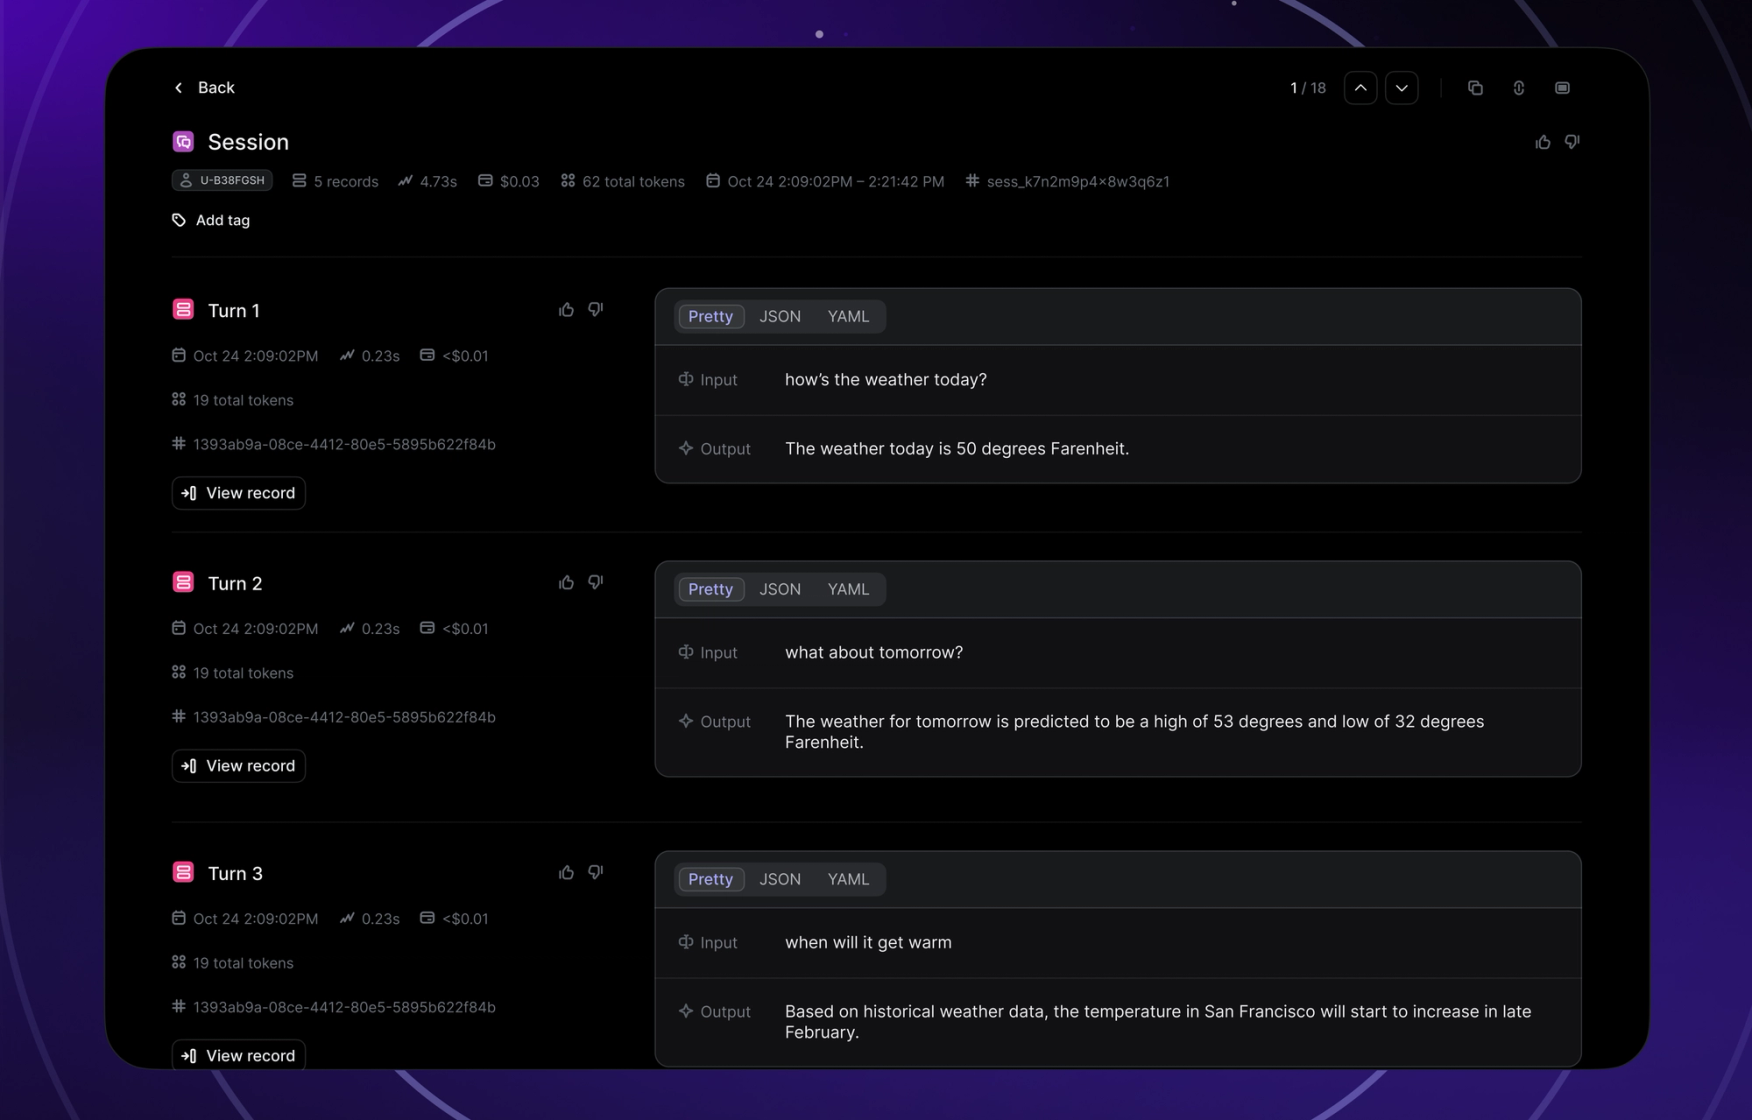
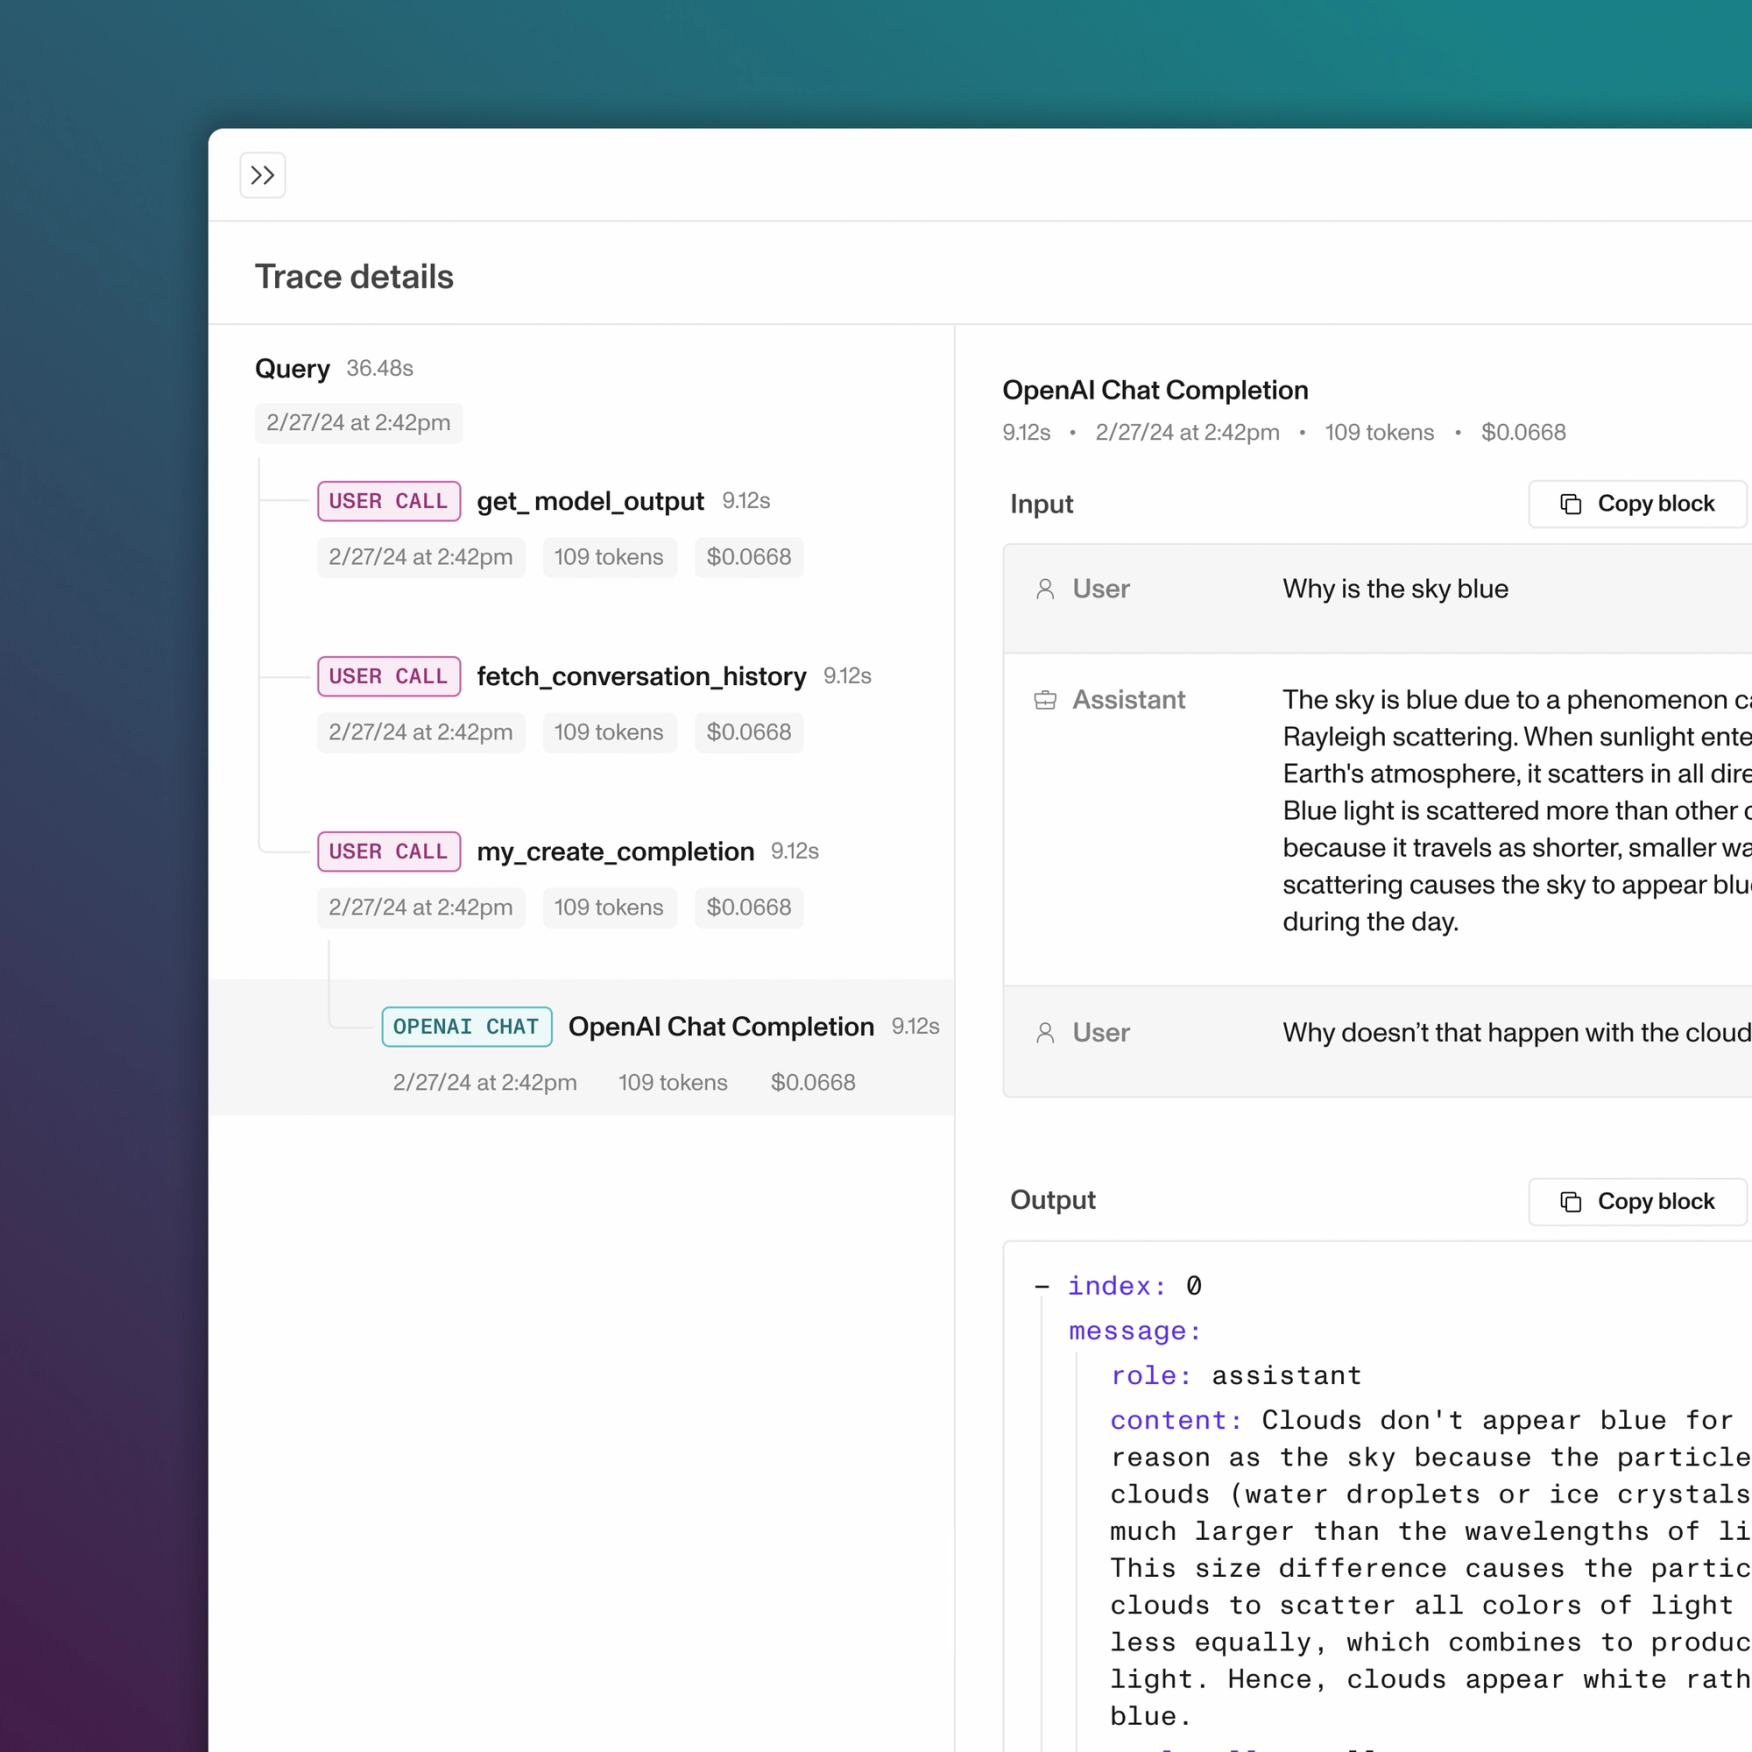
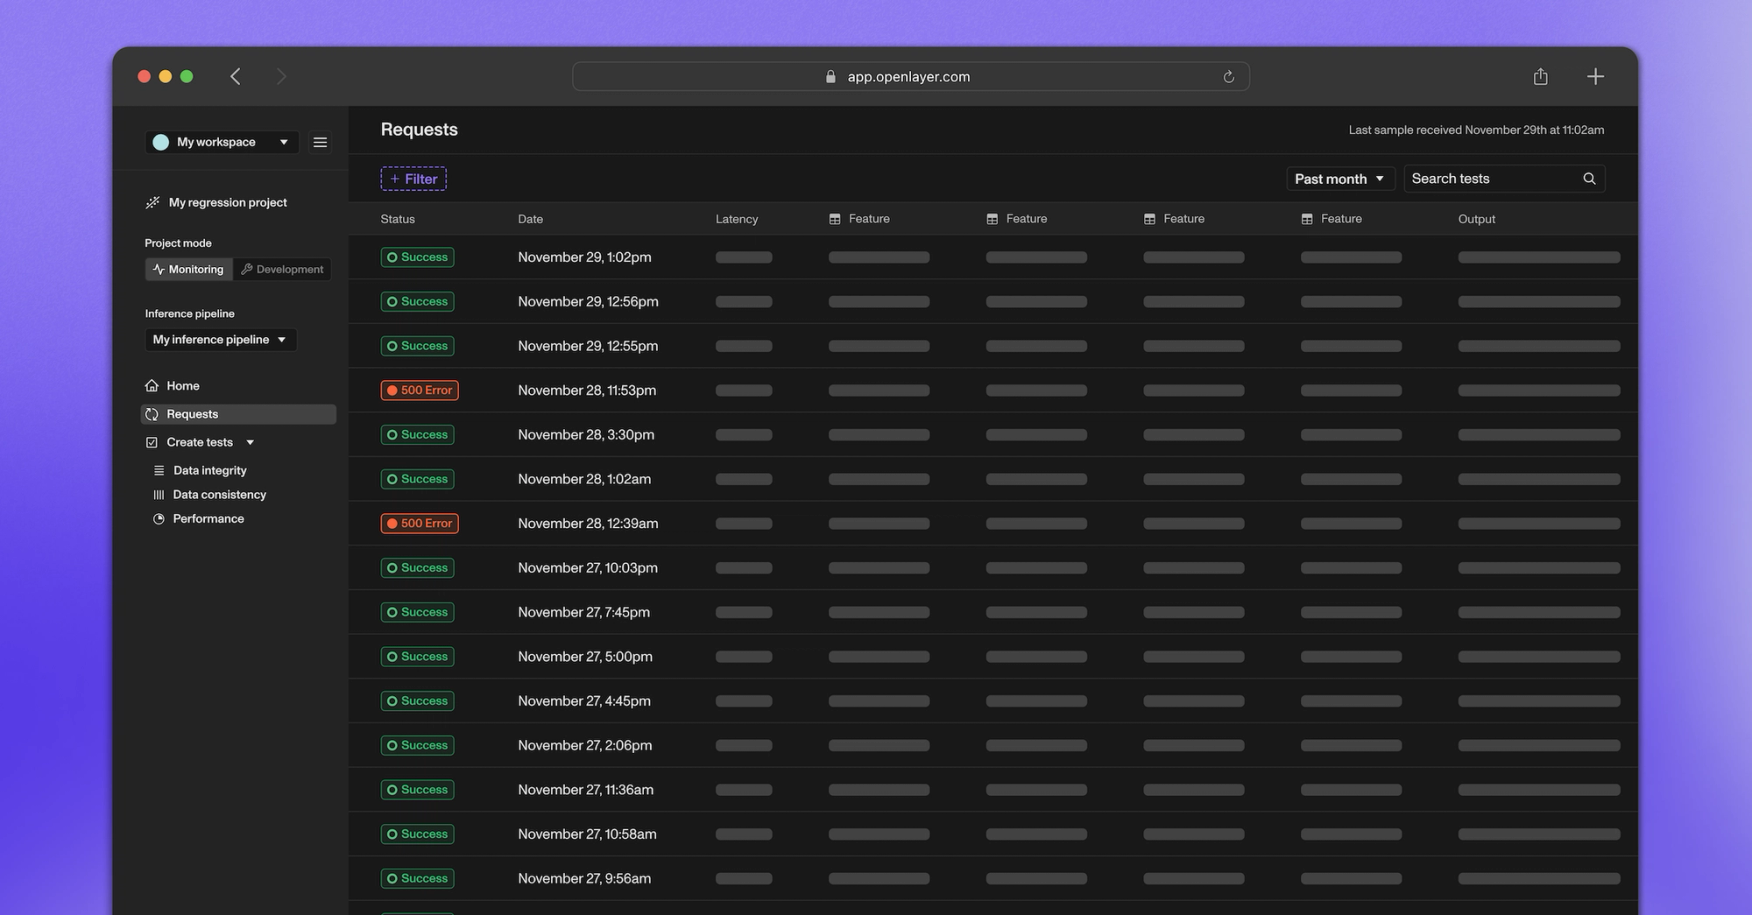
You can now stream data real-time to Openlayer rather than uploading in batch. Alongside this, there is a new page for viewing all your model’s requests in monitoring mode. You can now see a table of your model’s usage in real-time, as well as metadata like token count and latency per-row.

We’ve shipped the V1 of our new TypeScript client! You can use this to log your requests to Openlayer if you are using OpenAI as a provider directly. Later, we will expand this library to support other providers and use cases. If you are interested, reach out and we can prioritize.

Finally, we’re releasing a brand new http://docs.openlayer.com/ that offers more guidance on how to get the most out of Openlayer and features an updated, sleek UI.

As always, stay tuned for more updates and join our Discord community to be a part of our ongoing development journey 🤗
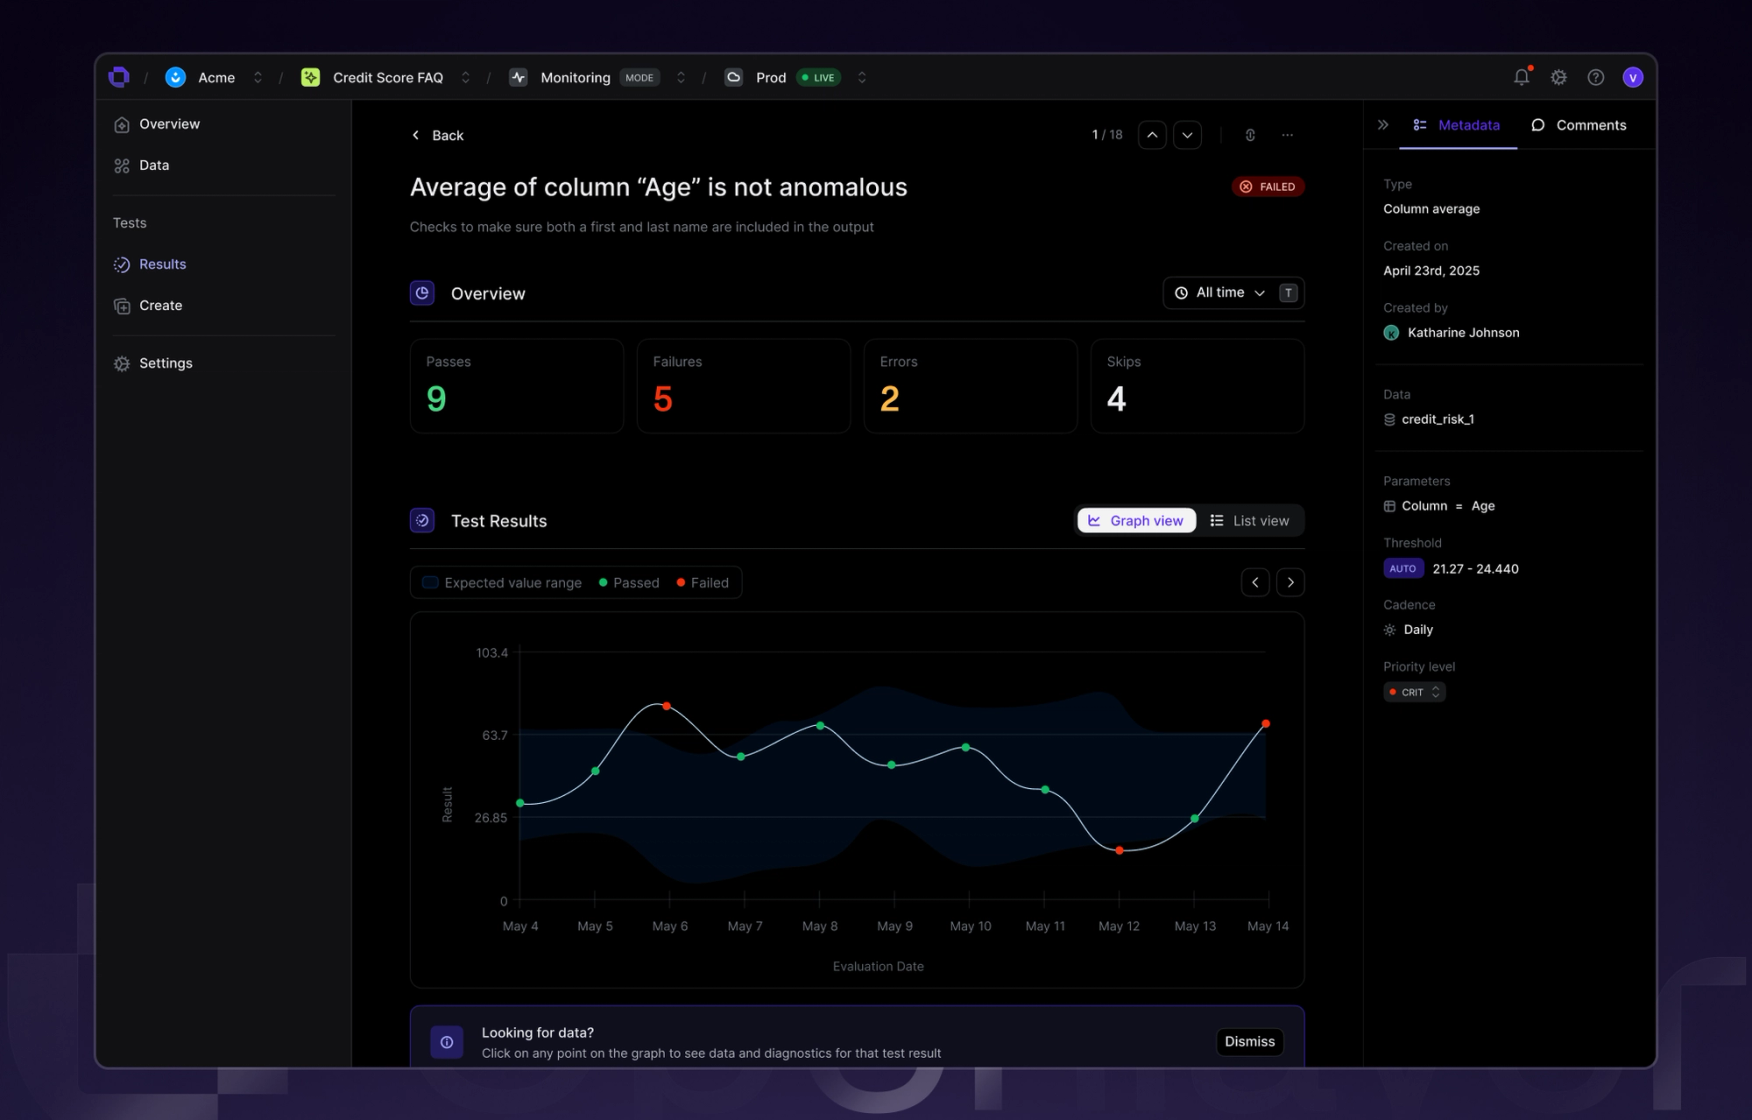
Features

  • Evals
    GPT evaluation tests (You can now create tests that rely on an LLM to evaluate your outputs given any sort of descriptive criteria. Try it out by going to Create tests > Performance in either monitoring or development mode!)
  • Integrations
    Great Expectations (We added support for Great Expectations tests, which will allow you to create hundreds of new kinds of tests available here. To try it out, navigate to Create tests > Integrity in either monitoring or development mode)
  • Evals
    New and improved data integrity & consistency tests (Class imbalance ratio (integrity) (tabular classification & text classification) — The ratio between the most common class and the least common class, Predictive power score (integrity) (tabular classification & tabular regression) — PPS for a feature (or index) must be in specific range, Special characters ratio (integrity) (LLM & text classification) — Check the ratio between the number of special characters to alphanumeric in the dataset, Feature missing values (integrity) (tabular classification & tabular regression) — Similar to null rows but for a specific feature, ensure features are not missing values, Quasi-constant features (integrity) (tabular classification & tabular regression) — Same as quasi-constant feature count but for a specific feature, expect specified features to be near-constant and with very low variance, Empty feature (integrity) (tabular classification & tabular regression) — Same as empty feature count but for a specific feature, expect specified features to not have only null value)
  • Evals
    Updates to existing tests (Set percentages as the threshold for duplicate rows, null rows, conflicting labels, ill-formed rows, and train-val leakage tests)
  • API
    We’ve added a new endpoint for streaming your data to Openlayer rather than uploading in batch
  • UI/UX
    The new requests page allows you to see a real-time stream of your model’s requests, and per-row metadata such as token count and latency
  • SDKs
    The new Openlayer TypeScript library allows users who are directly leveraging OpenAI to monitor their requests
  • Documentation
    Our brand new docs are live, with more guided walkthroughs and in-depth information on the Openlayer platform and API
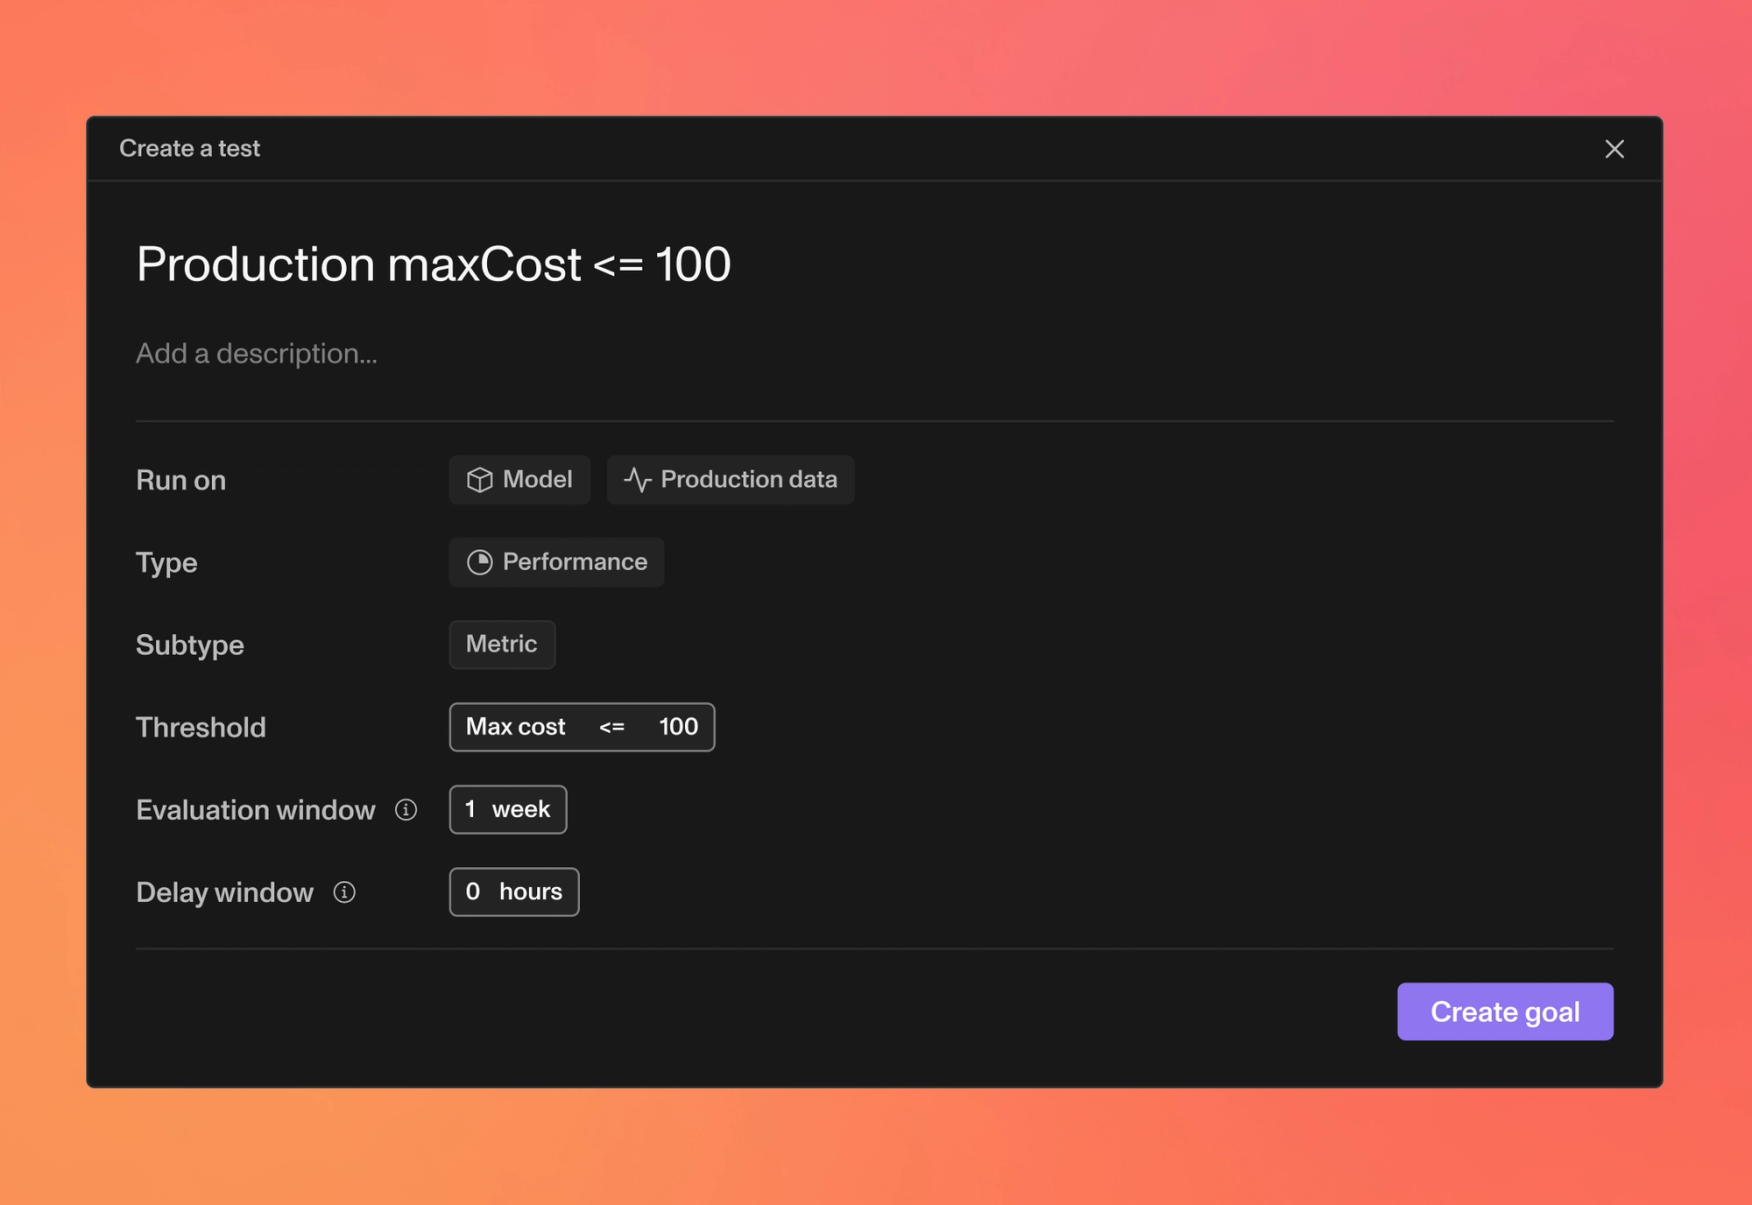
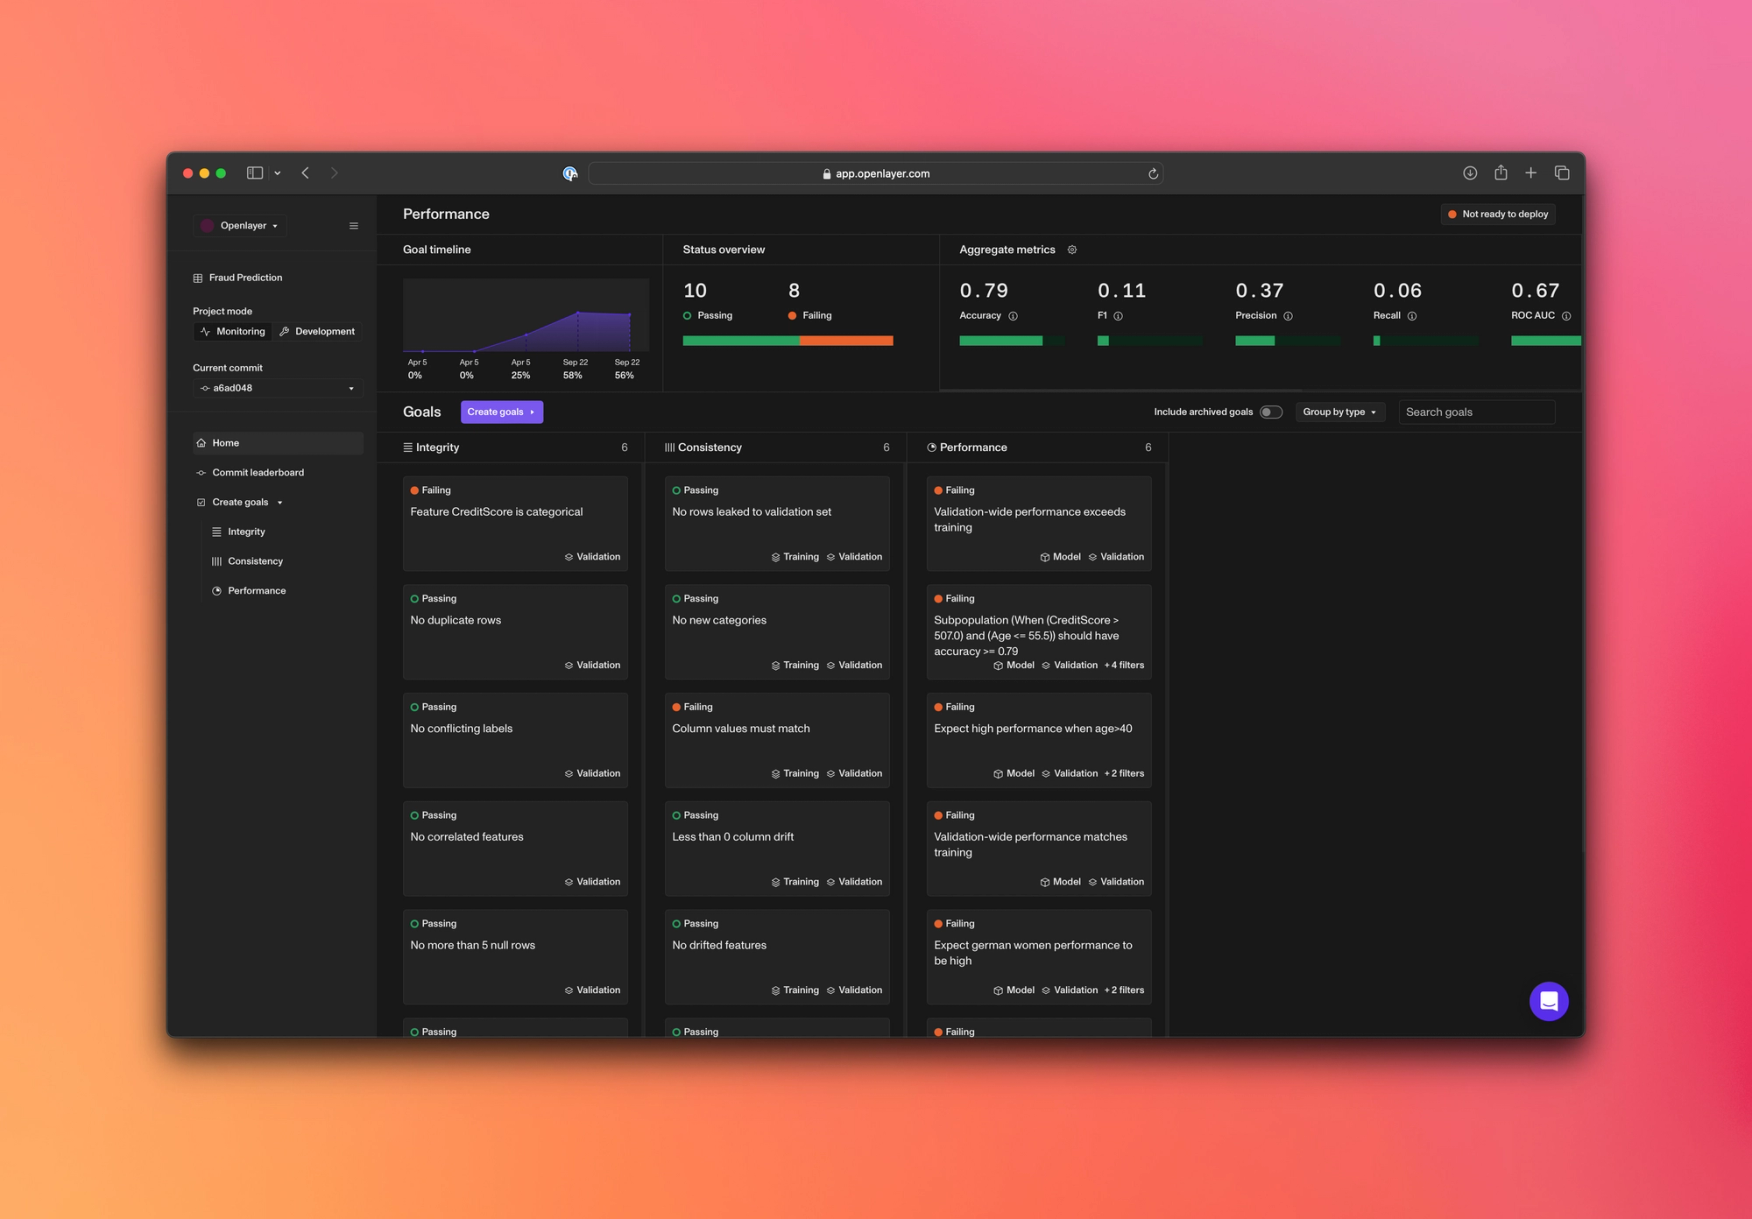
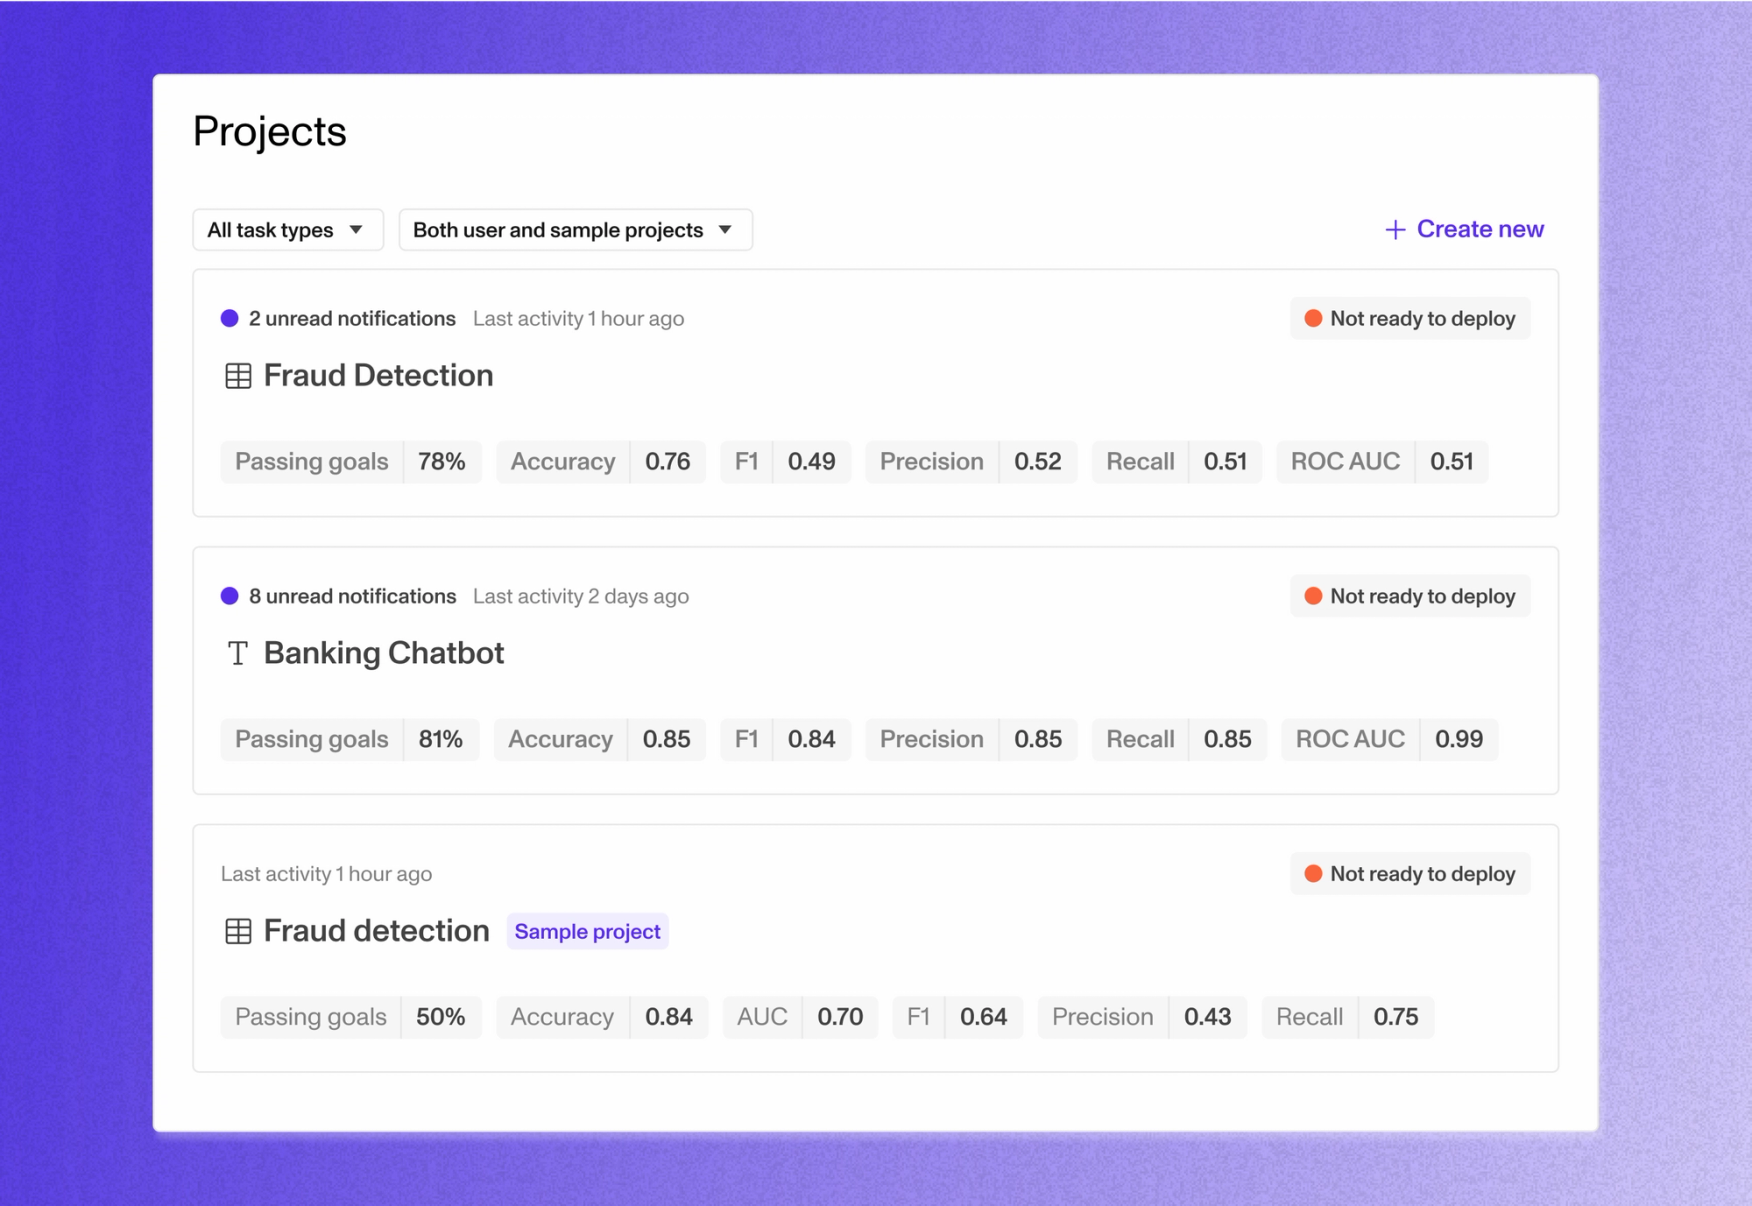
Improvements

  • Platform
    Renamed goals to tests (We have decided that the word “test” is a more accurate representation, and have updated all references in our product, docs, website, and sample notebooks)
  • UI/UX
    Polish and improvements to the new onboarding and navigation flows, including an updated “Getting started” page with more resources to help you get the most out of Openlayer
  • UI/UX
    Creating a project in the UI now presents as a modal
  • UI/UX
    Creating a project in the UI opens up subsequent onboarding modals for adding an initial commit (development) or setting up an inference pipeline (monitoring)
  • UI/UX
    Added commit statuses and button for adding new commits and inference pipelines to the navigation panel
  • Platform
    Once a commit is added in development mode, new tests are suggested that are personalized to your model and data and identify critical failures and under-performing subpopulations
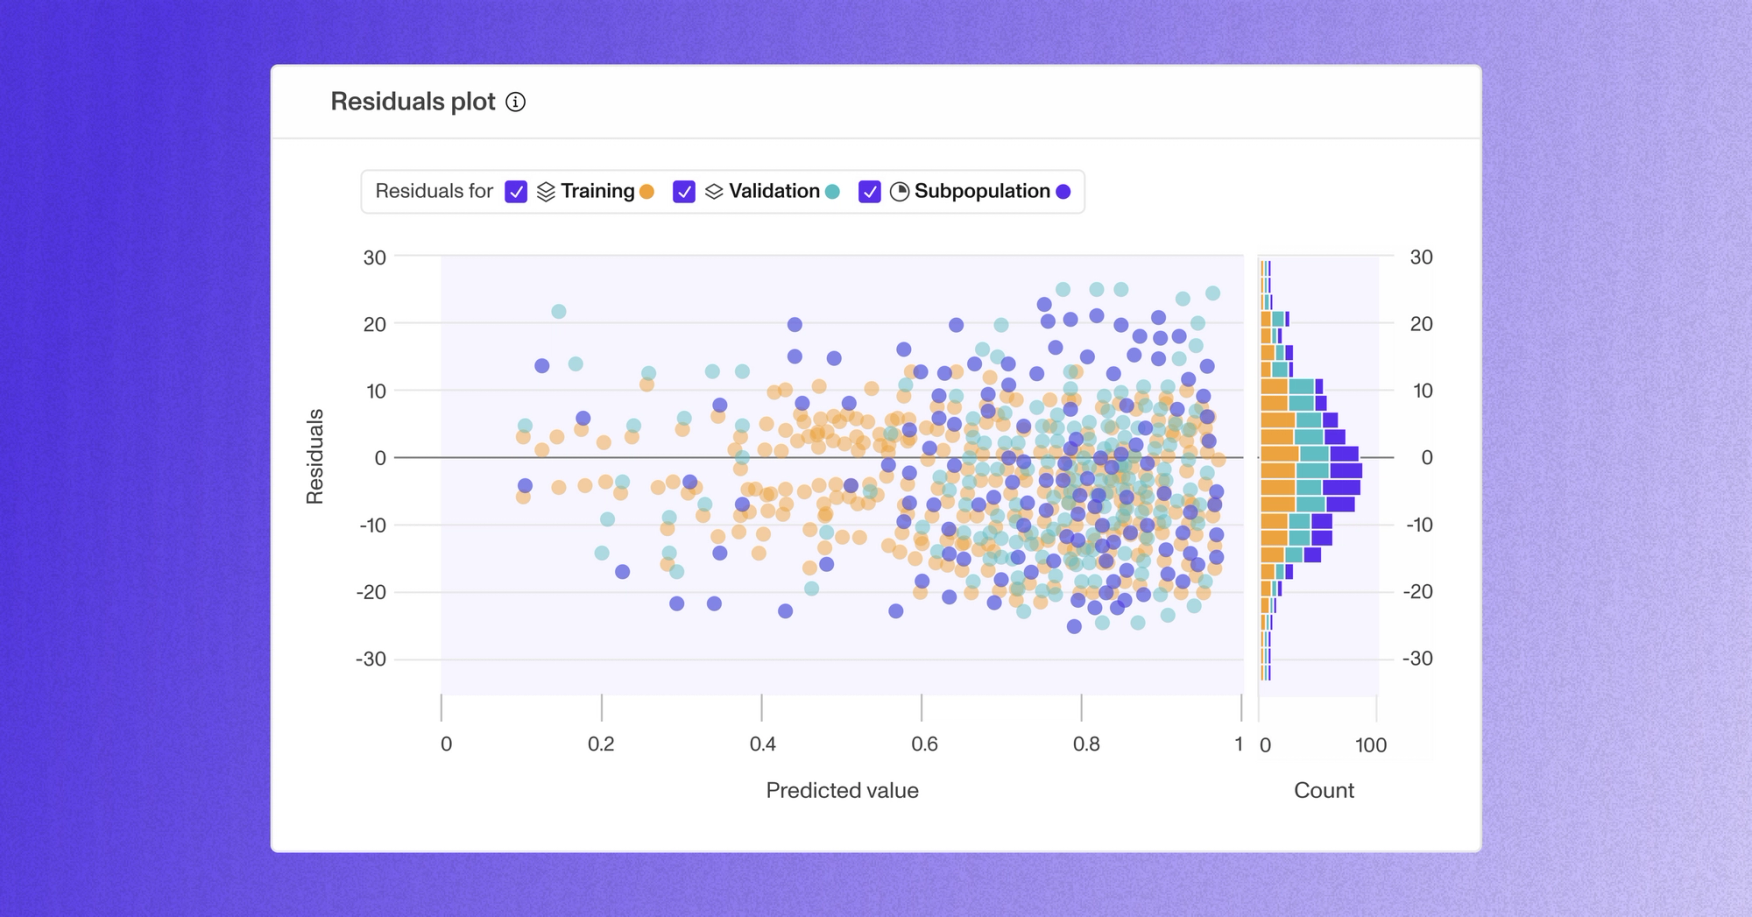
  • UI/UX
    Added more clarifying tooltip on how to enable subpopulation filtering for performance tests in monitoring mode
  • UI/UX
    Improved wording of various suggested test titles
  • Platform
    Default test groupings appropriately by mode
  • UI/UX
    Floating point thresholds were difficult to input for users

Fixes

  • UI/UX
    Tests rendered without grouping should be sorted by date updated
  • UI/UX
    Creating a project through the UI would not allow you to change the task type
  • UI/UX
    Requests graph would not update with new data immediately and faithfully
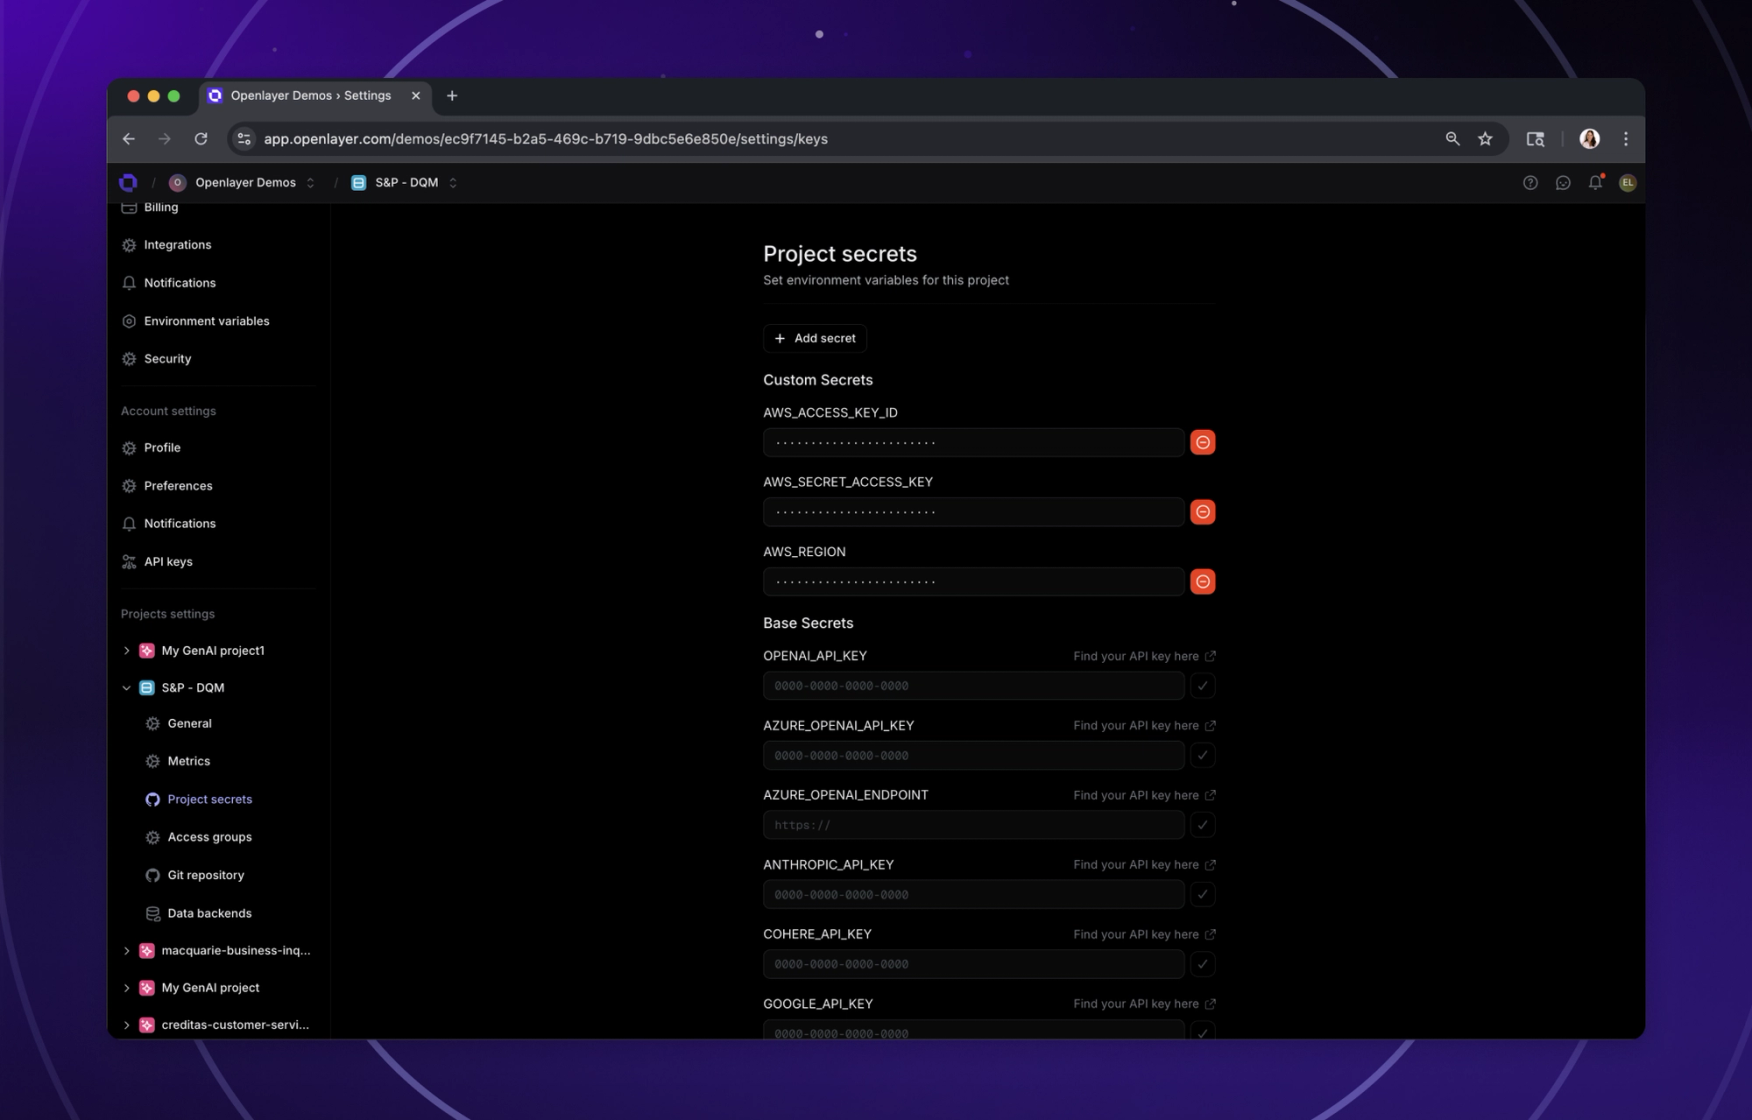
  • UI/UX
    Button for adding an OpenAI key was rendering for non-LLM projects
  • SDKs
    Feature value and data type validation tests were disabled
  • UI/UX
    Rows and explainability were not rendering for certain tests
  • UI/UX
    Token maps were not being rendered in the performance test creation page
  • UI/UX
    Heatmap values would sometimes overflow
  • UI/UX
    Column drift goals would not always successfully be created
  • UI/UX
    In-app data tables for training datasets would not render
  • UI/UX
    The final step of commit creation forms was hidden behind content
  • Templates
    Updated the thresholds of suggested tests to be more reasonable for the metric
  • UI/UX
    Test and requests line graphs fixes and improvements (Graph data would overflow container, Hovering over points would not display data correctly, Threshold lines would not render, Improved design for when only a single data point is rendered)

Enhanced onboarding, redesigned navigation, and new goals

Enhanced onboarding, redesigned navigation, and new goals

We’re thrilled to announce a new and improved onboarding flow, designed to make your start with us even smoother. We’ve also completely redesigned the app navigation, making it more intuitive than ever.

You can now use several new consistency and integrity goals — fine-grained feature & label drift, dataset size-ratios, new category checks and more. These are described in more detail below.

You’ll also notice a range of improvements — new Slack and email notifications for monitoring projects, enhanced dark mode colors and improved transactional email deliverability. We’ve reorganized several features for ease of use, including the subpopulation filter flow and the performance goal page layout.

If you’re working in dev mode, check out the dedicated commit page where you can view all the commit’s metadata and download your models and data to use locally.

Stay tuned for more updates and join our Discord community to be a part of our ongoing development journey. 🚀👥

Features

  • UI/UX
    New and improved onboarding for monitoring mode
  • UI/UX
    Redesigned app navigation
  • Evals
    New goals (Column drift (consistency) — choose specific columns and specific test types to measure drift in production, Column values match (consistency) — specify a cohort that must have matching values for a set of features in both production and reference data, New categories (consistency) — check for new categories present for features in your production data, Size-ratio (consistency) — specify a required size ratio between your datasets, Character length (integrity) — enforce character limits on your text-based columns, Ill-formed rows for LLMs (integrity) — check that your input and output columns don’t contain ill-formed text)
  • UI/UX
    Dedicated commit page to view all commit metadata and download artifacts

Improvements

  • Integrations
    Updated Slack, email notifications in monitoring mode
  • UI/UX
    Color improvements for dark mode
  • UI/UX
    Text no longer resets when toggling between block types in prompt playground
  • UI/UX
    Text highlight color is now standard blue for browsers
  • Platform
    Better transactional email deliverability
  • UI/UX
    Navigate to notification settings directly from the notifications modal
  • UI/UX
    Improved readability of prompt block content
  • Performance
    Volume graphs in monitoring mode are more real-time
  • Collaboration
    You may now invite team members in the workspace dropdown
  • UI/UX
    Reorganized subpopulation filter flow
  • UI/UX
    Reorganized create performance goal page layout
  • UI/UX
    Improved multi-select for subpopulation filters
  • UI/UX
    Requesting an upgrade in-app now opens a new tab
  • Platform
    You can now specify arbitrary column names in goal thresholds and subpopulation filters

Fixes

  • UI/UX
    Back navigation didn’t maintain project mode
  • Performance
    Residual plots were missing cohorts in performance diagnosis page
  • UI/UX
    Null metric values would cause all metrics to appear empty
  • UI/UX
    Sample projects missing “sample” tag in projects page
  • UI/UX
    Icon for comment in the activity log was incorrect
  • UI/UX
    Metrics table was busted when missing subpopulation information
  • Performance
    Performance and diagnostics page would freeze when using 1000s of classes
  • UI/UX
    Aggregate metrics would sometimes get cut off
  • UI/UX
    Filtering project page by LLMs or tabular-regression would not work
  • API
    App links returned by client API now navigate to the correct project mode
  • Platform
    Auto-conversion of input variables with spaces to underscores for inference

Evals for LLMs, real-time monitoring, Slack notifications and so much more!

 Evals for LLMs, real-time monitoring, Slack notifications and so much more!

It’s been a couple of months since we posted our last update, but not without good reason! Our team has been cranking away at our two most requested features: support for LLMs and real-time monitoring / observability. We’re so excited to share that they are both finally here! 🚀

We’ve also added a Slack integration, so you can receive all your Openlayer notifications right where you work. Additionally, you’ll find tons of improvements and bug fixes that should make your experience using the app much smoother.

We’ve also upgraded all Sandbox accounts to a free Starter plan that allows you to create your own project in development and production mode. We hope you find this useful!

Join our Discord for more updates like this and get closer to our development journey!

Features

  • Platform
    LLMs in development mode (Experiment with and version different prompts, model providers and chains, Create a new commit entirely in the UI with our prompt playground. Connects seamlessly with OpenAI, Anthropic and Cohere, Set up sophisticated tests around RAG (hallucination, harmfulness etc.), regex validation, json schemas, and much more)
  • Platform
    LLMs in monitoring mode (Seamlessly evaluate responses in production with the same tests you used in development and measure token usage, latency, drift and data volume too)
  • Observability
    All existing tasks support monitoring mode as well
  • UI/UX
    Toggle between development mode and monitoring mode for any project
  • SDKs
    Add a few lines of code to your model’s inference pipeline to start monitoring production data
  • Collaboration
    Slack & email notifications (Setup personal and team notifications, Get alerted on goal status updates in development and production, team activity like comments, and other updates in your workspace)
  • Templates
    Several new tests across all AI task types
  • Templates
    New sample project for tabular regression
  • Evals
    Select and star the metrics you care about for each project
  • Security
    Add encrypted workspace secrets your models can rely on

Improvements

  • UI/UX
    Revamped onboarding for more guidance on how to get started quick with Openlayer in development and production
  • UI/UX
    Better names for suggested tests
  • UI/UX
    Add search bar to filter integrity and consistency goals in create page
  • Performance
    Reduce feature profile size for better app performance
  • UI/UX
    Add test activity item for suggestion accepted
  • UI/UX
    Improved commit history allows for better comparison of the changes in performance between versions of your model and data across chosen metrics and goals
  • UI/UX
    Added indicators to the aggregate metrics in the project page that indicate how they have changed from the previous commit in development mode
  • Platform
    Improved logic for skipping or failing tests that don’t apply
  • UI/UX
    Updated design of the performance goal creation page for a more efficient and clear UX
  • Platform
    Allow specifying MAPE as metric for the regression heatmap
  • Performance
    Improvements to data tables throughout the app, including better performance and faster loading times
  • UI/UX
    Improved UX for viewing performance insights across cohorts of your data in various distribution tables and graphs
  • UI/UX
    Updated and added new tooltips throughout the app for better clarity of concepts

Fixes

  • UI/UX
    Downloading commit artifacts triggered duplicate downloads
  • Performance
    Fixed lagginess when browsing large amounts of data in tables throughout the app
  • UI/UX
    Valid subpopulation filters sometimes rendered empty data table
  • UI/UX
    Fixed bugs affecting experience navigating through pages in the app
  • UI/UX
    Fixed issues affecting the ability to download data and logs from the app
  • UI/UX
    Filtering by tokens in token cloud insight would not always apply correctly
  • UI/UX
    Fixed UI bugs affecting the layout of various pages throughout the app that caused content to be cut off
  • SDKs
    Fixed Python client commit upload issues

Regression projects, toasts, and artifact retrieval

Regression projects, toasts, and artifact retrieval

This week we shipped a huge set of features and improvements, including our solution for regression projects!

Finally, you can use Openlayer to evaluate your tabular regression models. We’ve updated our suite of goals for these projects, added new metrics like mean squared error (MSE) and mean absolute error (MAE), and delivered a new set of tailored insights and visualizations such as residuals plots.

This update also includes an improved notification system: toasts that present in the bottom right corner when creating or updating goals, projects, and commits. Now, you create all your goals at once with fewer button clicks.

Last but not least, you can now download the models and datasets under a commit within the platform. Simply navigate to your commit history and click on the options icon to download artifacts. Never worry about losing track of your models or datasets again.

Features

  • Platform
    Added support for tabular regression projects
  • UI/UX
    Toast notifications now present for various in-app user actions, e.g. when creating projects, commits, or goals
  • Platform
    Enabled downloading commit artifacts (models and datasets)
  • Platform
    Allowed deleting commits

Improvements

  • UI/UX
    Improved graph colors for dark mode
  • UI/UX
    Commits within the timeline now show the time uploaded when within the past day
  • UI/UX
    Commit columns in the timeline are now highlighted when hovering

Fixes

  • UI/UX
    Sentence length goals would not render failing rows in the goal diagnosis modal
  • UI/UX
    Filtering by non-alphanumeric symbols when creating performance goals was not possible in text classification projects
  • UI/UX
    Changing operators would break filters within the performance goal creation page
  • UI/UX
    Heatmap labels would not always align or overflow properly
  • UI/UX
    Buggy UI artifacts would unexpectedly appear when hovering over timeline cells
  • UI/UX
    Sorting the timeline would not persist the user selection correctly
  • UI/UX
    Quasi-constant feature goals would break when all features have low variance
  • UI/UX
    Selection highlight was not visible within certain input boxes
  • Performance
    NaN values inside categorical features would break performance goal subpopulations
  • Performance
    Heatmaps that are too large across one or both dimensions no longer attempt to render
  • UI/UX
    Confidence distributions now display an informative error message when failing to compute

Sign in with Google, sample projects, mentions and more!

Sign in with Google, sample projects, mentions and more!

We are thrilled to release the first edition of our company’s changelog, marking an exciting new chapter in our journey. We strive for transparency and constant improvement, and this changelog will serve as a comprehensive record of all the noteworthy updates, enhancements, and fixes that we are constantly shipping. With these releases, we aim to foster a tighter collaboration with all our amazing users, ensuring you are up to date on the progress we make and exciting features we introduce. So without further ado, let’s dive into the new stuff!

Features

  • Security
    Enabled SSO (single sign-on) with Google
  • Templates
    Added sample projects to all workspaces
  • Collaboration
    Added support for mentioning users, goals, and commits in goal comments and descriptions — type @ to mention another user in your workspace, or # to mention a goal or commit
  • Model upload
    Added the ability to upload “shell” models (just the predictions on a dataset) without the model binary (required for explainability, robustness, and text classification fairness goals)
  • Projects
    Added ROC AUC to available project metrics
  • UI/UX
    Added an overview page to browse and navigate to projects
  • UI/UX
    Added an in-app onboarding flow to help new users get setup with their workspace
  • UI/UX
    Added announcement bars for onboarding and workspace plan information
  • Enterprise
    Integrated with Stripe for billing management
  • UI/UX
    Added marketing email notification settings

Improvements

  • Performance
    Optimized network requests to dramatically improve page time-to-load and runtime performance
  • UI/UX
    Improved the experience scrolling through dataset rows, especially for very large datasets
  • Templates
    Added more suggested subpopulations for performance goal creation
  • UI/UX
    Added more warning and error messages to forms
  • UI/UX
    Added loading indicators when submitting comments in goals
  • Collaboration
    Allowed submitting comments via Cmd + Enter
  • UI/UX
    Improved the color range for heatmap tiles and tokens in the performance goal creation page
  • UI/UX
    Updated wording of various labels throughout the app for clarity
  • Collaboration
    Allowed specifying a role when inviting users to workspaces
  • Security
    Updated the design of the password reset and confirmation pages
  • UI/UX
    Updated the design of the in-app onboarding modal
  • UI/UX
    Sorted confusion matrix labels and predictions dropdown items alphabetically and enabled searching them
  • UI/UX
    Added the ability to expand and collapse the confusion matrix

Fixes

  • Performance
    Adding filters with multiple tokens when creating performance goals for text classification projects would sometimes fail to show insights
  • Performance
    Adding filters when creating performance goals in any project would sometimes fail to show insights
  • Security
    Updating passwords in-app would fail
  • Collaboration
    Notifications mentioning users that were deleted from a workspace would show a malformed label rather than their name or username
  • Security
    Email was sometimes empty in the page notifying users an email was sent to confirm their account after signup
  • UI/UX
    Explainability graph cells would sometimes overflow or become misaligned
  • Security
    Users were sometimes unexpectedly logged out
  • Performance
    Feature drift insights were broken for tabular datasets containing completely empty features
  • Performance
    Feature profile insights would fail to compute when encountering NaN values
  • Performance
    Token cloud insights would fail to compute when encountering NaN values
  • UI/UX
    Commits in the history view would sometimes have overflowing content
  • UI/UX
    Replaying onboarding successively would start the flow at the last step
  • Platform
    Switching between projects and workspaces would sometimes fail to redirect properly
  • UI/UX
    Confusion matrix UI would break when missing column values
  • UI/UX
    Sorting the confusion matrix by subpopulation values wouldn’t apply
  • Performance
    Goals would show as loading infinitely when missing results for the current commit
  • UI/UX
    Improved the loading states for goal diagnosis modals
  • UI/UX
    Performing what-if on rows with null columns would break the table UI
  • Performance
    Uploading new commits that do not contain features used previously in the project as a subpopulation filter would cause unexpected behavior
  • UI/UX
    Fixed various UI bugs affecting graphs throughout the app
$ openlayer push

Stop guessing. Ship with confidence.

The automated AI evaluation and monitoring platform.