Precision and Recall in Machine Learning (Jan 2026)


Your spam filter can catch every spam email by flagging everything as spam, giving you perfect recall. But your precision tanks because you're also blocking legitimate mail. Or you can flag only the most obvious spam, boosting precision while letting borderline cases slip through and tanking recall. This tradeoff isn't a bug in your model, it's a fundamental constraint of classification that you deal with by understanding what each metric measures and which errors your application can tolerate.
TLDR:
- Precision measures correct positive predictions; recall measures detected positive cases.
- Optimize precision when false positives cost more (spam filters); recall when missing cases is critical (cancer screening).
- F1 score combines both using harmonic mean, penalizing imbalanced precision-recall pairs.
- Accuracy misleads on imbalanced data; a 99% accurate fraud detector can catch zero fraud.
- Openlayer automates precision-recall validation with CI-integrated testing and production monitoring across ML and GenAI systems.
What precision and recall are in machine learning
Classification models make predictions with varying consequences. A spam filter missing legitimate email differs from a cancer screening missing a diagnosis. Precision and recall capture both dimensions of performance:
- Precision measures correct positive predictions. If your model flags 100 emails as spam, precision shows how many actually are spam.
- Recall measures detected positive cases. If 100 spam emails exist, recall shows how many your model caught.
These metrics trade off. Perfect recall comes from predicting positive everywhere, destroying precision. High precision requires restrictive predictions, reducing recall. Balance depends on error costs.
The confusion matrix explained
The confusion matrix organizes prediction outcomes into four categories:
- True positives (TP) are correct positive predictions.
- False positives (FP) are incorrect positive predictions, also called Type I errors.
- True negatives (TN) are correct negative predictions.
- False negatives (FN) are incorrect negative predictions, also called Type II errors.
| Predicted Positive | Predicted Negative | |
|---|---|---|
| Actually Positive | True Positive (TP) | False Negative (FN) |
| Actually Negative | False Positive (FP) | True Negative (TN) |
All performance metrics are determined from these four values. So how do you calculate them?
Precision formula and when to optimize for it
Precision divides correct positive predictions by total positive predictions: Precision = TP / (TP + FP).
Where TP is true positives and FP is false positives. The formula answers: "When the model predicts positive, how often is it right?" You should optimize for precision when false positives carry higher cost than false negatives. Email spam filters, for example, prioritize precision because flagging legitimate mail as spam frustrates users more than letting occasional spam through.
Recall formula and when to optimize for it
Recall divides correct positive predictions by total actual positives: Recall = TP / (TP + FN).
Where TP is true positives and FN is false negatives. The formula answers: "Of all actual positive cases, how many did the model catch?" You should optimize for recall when false negatives carry severe consequences. For example, cancer screening prioritizes recall because missing a diagnosis delays treatment and risks lives. Fraud detection systems similarly favor recall, accepting more false alarms to catch fraudulent transactions before financial damage occurs.
The precision and recall tradeoff
It's impossible to have 100% precision and 100% recall. There is a balance to be struck between the two measures based upon the end-result requirements (i.e., the output of the model). Classification models output probabilities that require thresholds to produce binary predictions. Each threshold, though, moves precision and recall in opposite directions:
- Lower thresholds increase predictions, raising recall by capturing more true positives while reducing precision through added false positives.
- Higher thresholds restrict predictions, improving precision by filtering uncertain cases while lowering recall by missing borderline positives.
This tradeoff reflects a fundamental constraint: expanding the positive class captures more true positives but admits more false positives. Select thresholds based on business requirements, not by maximizing either metric alone.
F1 score as the harmonic mean of precision and recall
F1 score combines precision and recall into a single metric using the harmonic mean: F1 = 2 × (Precision × Recall) / (Precision + Recall).
The harmonic mean penalizes imbalanced values. If precision is 0.9 and recall is 0.1, the F1 score drops to 0.18 despite an arithmetic mean of 0.5. You should use F1 when you need a single comparison metric but can't prioritize one over the other. For imbalanced datasets or asymmetric costs, optimize precision or recall directly.
Accuracy vs precision vs recall
Accuracy divides correct predictions by total predictions: Accuracy = (TP + TN) / (TP + TN + FP + FN).
For balanced datasets, accuracy works well. For imbalanced data, it misleads. Consider fraud detection with 1% fraud rate. A model predicting "not fraud" for every transaction achieves 99% accuracy while catching zero fraud cases. Precision and recall expose this failure. The fraud detector's recall is 0% because it catches no fraud. Use precision and recall when positive class matters. Reserve accuracy for balanced problems where both classes carry equal weight.
How to calculate precision and recall in Python
Now that you have an understanding of accuracy, precision, and recall, let's look at how to implement them in Python.
from sklearn.metrics import precision_score, recall_score, confusion_matrix

y_true = [0, 1, 1, 0, 1, 1, 0, 1, 0, 0]
y_pred = [0, 1, 0, 0, 1, 1, 0, 1, 1, 0]

precision = precision_score(y_true, y_pred)
recall = recall_score(y_true, y_pred)

print(f"Precision: {precision:.3f}")
print(f"Recall: {recall:.3f}")
For manual calculation from a confusion matrix:
cm = confusion_matrix(y_true, y_pred)
tn, fp, fn, tp = cm.ravel()

precision = tp / (tp + fp)
recall = tp / (tp + fn)
The classification_report function outputs all metrics in a single call:
from sklearn.metrics import classification_report

print(classification_report(y_true, y_pred))
Precision and recall for imbalanced datasets
Imbalanced datasets complicate issues further because they expose accuracy's failure. For example, when negatives outnumber positives 100:1, a model predicting all negatives achieves 99% accuracy with zero usefulness.
Precision and recall reveal the real story. That same useless model shows 0% recall, immediately surfacing the problem. Assess imbalanced models with precision-recall first. Calculate metrics separately for each class. Stratified sampling during training and validation preserves class ratios. Finally, set decision thresholds based on cost asymmetry, not default 0.5 cutoffs.
Precision-recall curves and threshold selection
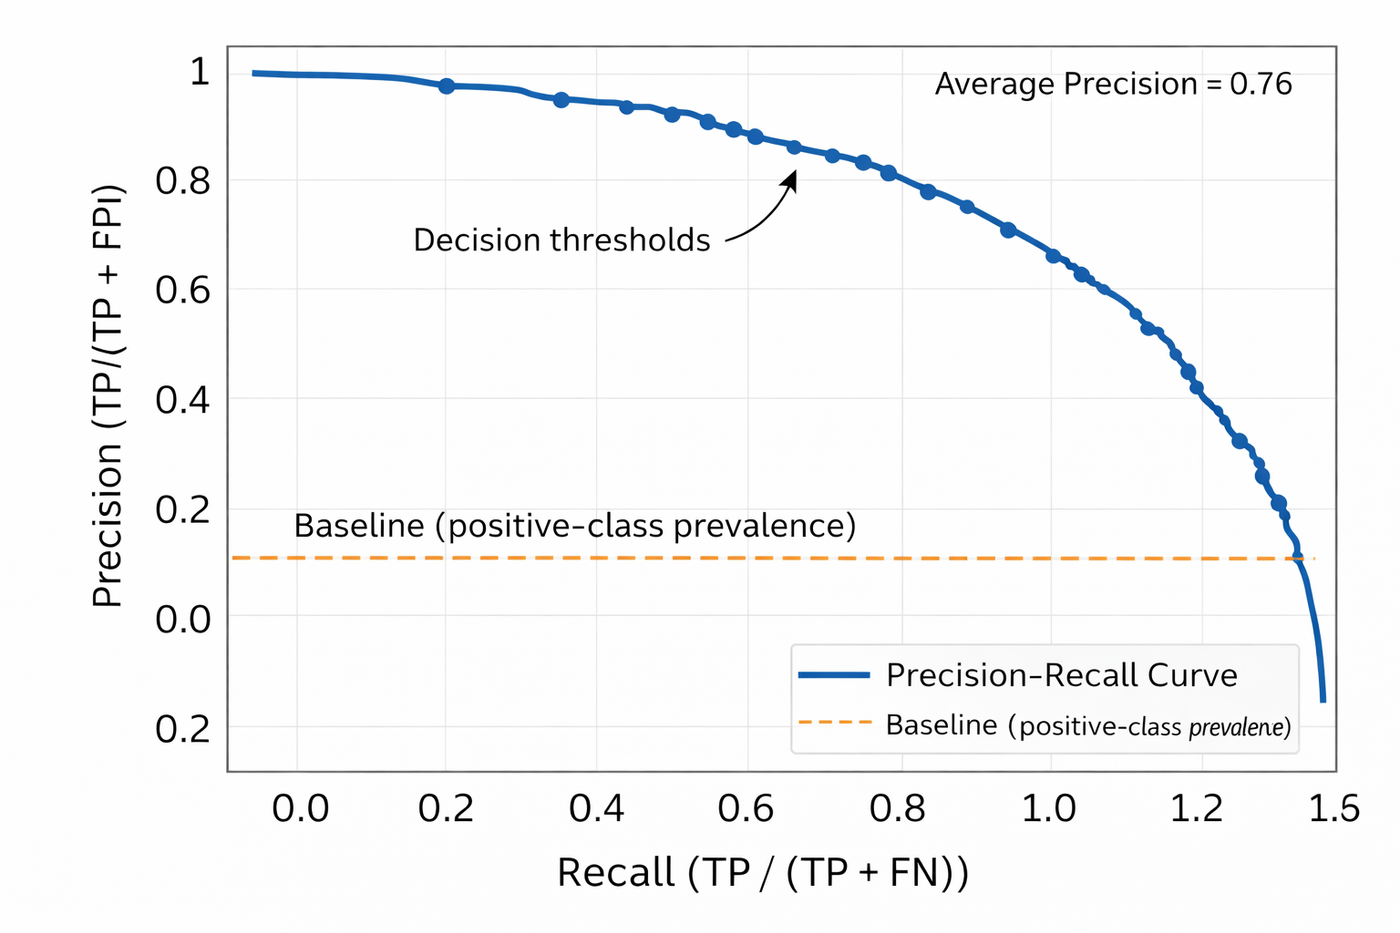
Precision-recall curves plot precision against recall at every classification threshold. Each point represents a different threshold, showing the full tradeoff options instead of a single snapshot. Reading the curve:
- Top-right represents ideal performance.
- Bottom-left shows poor performance. Curves closer to the top-right corner outperform those sagging toward the origin.
- Area under the precision-recall curve (AUC-PR) summarizes performance with a single number between 0 and 1.
Unlike accuracy, AUC-PR stays informative for imbalanced datasets because it ignores true negatives.
Using precision and recall to validate AI systems with Openlayer
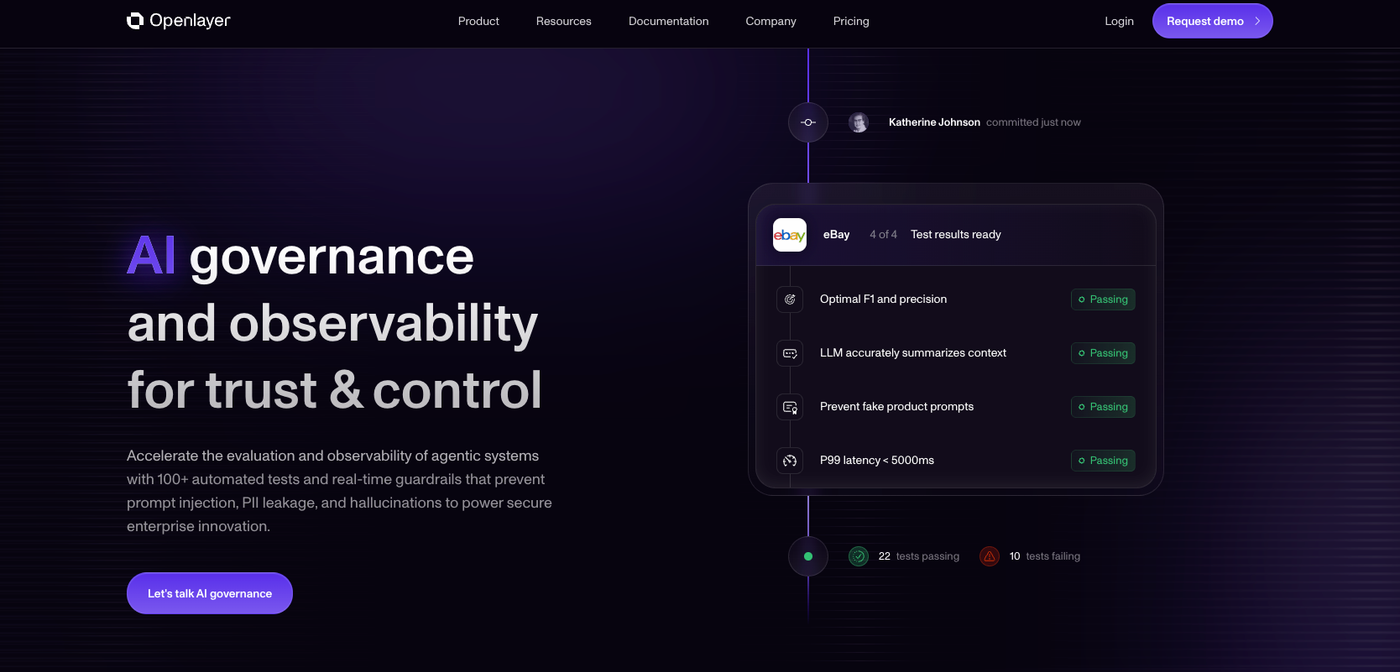
Openlayer automates precision and recall validation through CI-integrated testing and production monitoring. Teams define acceptable thresholds, then Openlayer runs evaluations on every commit and continuously on live inference data, triggering alerts when metrics degrade before user impact occurs.
Final thoughts on precision and recall metrics
Knowing when to optimize for precision and recall separates models that look good on paper from ones that work in production. Every classification threshold represents a choice about which mistakes your system will make. Build your next classifier by starting with the confusion matrix, calculating both metrics, and selecting thresholds based on the real costs of false positives versus false negatives.
FAQ
How do I choose between optimizing for precision or recall?
Base your choice on error costs: optimize for precision when false positives are expensive (like spam filters flagging legitimate emails), and optimize for recall when false negatives carry severe consequences (like cancer screening missing diagnoses).
What is the F1 score and when should I use it?
The F1 score is the harmonic mean of precision and recall, calculated as 2 × (Precision × Recall) / (Precision + Recall). Use it when you need a single comparison metric across models but can't prioritize precision or recall individually.
Why is accuracy misleading for imbalanced datasets?
Accuracy fails on imbalanced data because a model predicting only the majority class achieves high accuracy while being useless. For example, predicting "not fraud" for every transaction in a 1% fraud dataset yields 99% accuracy but 0% recall, catching zero fraud cases.
How do I calculate precision and recall from a confusion matrix?
Precision equals TP / (TP + FP), measuring correct positive predictions out of all positive predictions. Recall equals TP / (TP + FN), measuring detected positives out of all actual positives. Both come directly from the confusion matrix's four values: true positives, false positives, true negatives, and false negatives.
What does a precision-recall curve show me that single metrics don't?
Precision-recall curves plot the full tradeoff options across all classification thresholds, showing how precision and recall shift in opposite directions. This reveals the complete performance profile instead of a single snapshot, helping you select thresholds based on business requirements instead of arbitrary defaults.