LLM observability: complete guide to monitoring AI applications in February 2026
You can't debug what you can't see. Your LLM might be drifting away from its training distribution, burning through your token budget on verbose prompts, or falling victim to prompt injection attempts. None of these show up in standard application logs. You need visibility into model behavior, retrieval workflows, and guardrail triggers across your entire request lifecycle. That's where LLM observability comes in: it tracks quality, performance, cost, and security so you know exactly how your AI behaves at scale.
TLDR:
- LLM observability tracks model behavior across traces, spans, and metrics to catch hallucinations, PII leaks, and drift before users notice.
- Production systems require monitoring quality (groundedness, relevance), performance (latency per token), cost (token attribution), and security (prompt injection attempts).
- Evaluation validates models pre-deployment on test datasets; monitoring detects real-world failures in live traffic.
- RAG workflows need specialized tracking for context relevancy, groundedness, and retrieval precision to prevent irrelevant responses.
- Openlayer provides 100+ automated tests, real-time guardrails, and compliance mapping across development and production environments.
What is LLM observability

LLM observability tracks, measures, and analyzes how AI systems behave across their entire request lifecycle. It captures inputs, outputs, retrieved context, model behavior, and downstream application metrics to validate production performance. Traditional monitoring reports when systems break. LLM observability reveals when models drift, hallucinate, leak sensitive data, or fail quality thresholds with LLM guardrails in place. It spans runtime telemetry and post-inference analysis, capturing traces across multi-step workflows where models call APIs, retrieve documents, or chain reasoning steps.
The goal is visibility into model behavior at scale. Teams detect when retrieval quality degrades, latency impacts user experience, or new prompt versions introduce regressions.
Why LLM observability matters for production AI systems
Production AI systems fail differently than traditional software. Models generate unpredictable outputs, retrieve irrelevant context, or expose sensitive data without throwing errors. By the time users complain, the damage is done.
Over 80% of enterprises are expected to deploy generative AI applications or APIs by 2026, up from less than 5% in 2023. This acceleration forces organizations to move from experimentation to production without proven patterns. Observability closes that gap. It surfaces hallucinations before customers notice, flags prompt injection attempts in real time, and proves compliance when regulators ask.
How LLM observability differs from traditional ML monitoring
Traditional ML monitoring tracks numeric predictions from deterministic models. You measure accuracy, precision, recall, and data drift against fixed schemas. But, LLM observability measures text generation quality, semantic drift, and retrieval relevance. Outputs vary between runs. The same prompt produces different completions. You track token usage, latency per completion, context utilization, hallucinations, and PII exposure. Where traditional systems flag schema violations, LLM monitoring tools require semantic evaluation to catch regressions in tone, factuality, or groundedness that numeric metrics miss.
Core components of LLM observability systems
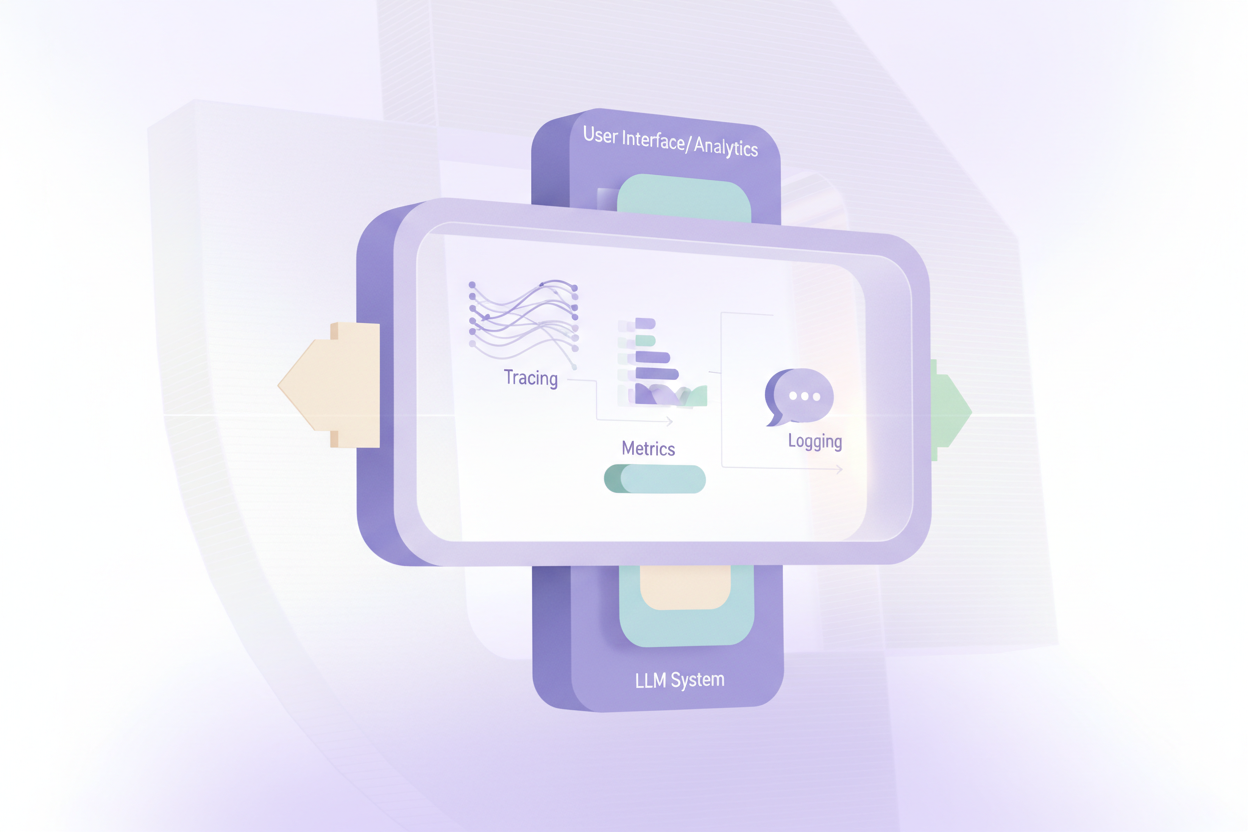
LLM observability systems depend on five core primitives:
- Traces. These map the full request path from user input to final response. In multi-step workflows, a single trace captures the model call, retrieval query, context injection, and generation step.
- Spans. These represent individual operations within a trace. One span logs the embedding lookup, another logs the vector search, another logs the completion request. Spans carry metadata like token counts, model versions, and timestamps.
- Metrics. These aggregate span data into time-series signals: average latency, tokens per request, error rates, and completion length distributions.
- Logs. These capture raw prompt text, retrieved chunks, and generated outputs.
- Events. These flag discrete incidents like guardrail triggers, PII detections, or prompt injection attempts.
Key metrics and signals to track in production
Production observability requires tracking metrics across quality, performance, cost, and safety dimensions:
- Quality metrics include hallucination rates, groundedness scores, context relevancy, and output coherence.
- Performance signals cover latency per token, time to first token, and throughput.
- Cost tracking measures tokens consumed, API charges per request, and retrieval overhead.
- Safety signals flag PII exposure, toxic content, bias in responses, and prompt injection attempts.
Finally, drift detection compares semantic distributions between training and inference to catch degradation. Nearly 60% of engineering teams report struggling with alert fatigue. Set thresholds tied to user impact: response times above 3 seconds, hallucination rates exceeding 2%, or cost per session doubling baseline.
Observability for RAG systems and retrieval workflows
RAG systems add retrieval layers between user queries and model outputs. Observability tracks whether retrieved documents answer the question, whether the model used them correctly, and whether responses stay grounded in source material. Context relevancy, then, measures how retrieved content relates to the user query. Low relevancy means the retrieval step fetched irrelevant documents, forcing the model to improvise or hallucinate. Groundedness scores validate that factual claims trace back to retrieved context. Context utilization tracks how much retrieved material the model referenced. Needle-in-a-haystack tests verify retrieval precision by embedding specific facts in large document sets and checking whether the system surfaces them accurately.
Real-time guardrails and security monitoring
When you are collecting safety metrics, you are making sure that your AI application is secure. That's why development teams implement real-time guardrails that intercept requests before they reach your model or database. They scan inputs for prompt injection patterns, PII exposure, jailbreak attempts, and data exfiltration signals. Blocked requests never execute, preventing leaks or manipulation.
With those guardrails in place, real-time monitoring is critical. But security monitoring differs from post-inference logging. Guardrails act as filters. If a user tries to bypass system instructions or extract training data, the guardrail triggers immediately. The request stops. The incident logs. Your downstream systems stay protected.
Observability, then, tracks every blocked attempt, showing which attack patterns appear most often and which users trigger guardrails repeatedly.
Cost monitoring and token-level attribution
Remember that cost is a key metric you need to collect. Through those metrics, you might find that verbose system prompts waste tokens, that certain retrieval queries spike costs, or that specific users drive runaway usage. Token-level cost tracking breaks down spending by user, session, feature, or model version. You identify which prompts burn through budgets, which users consume disproportionate resources, and where retrieval overhead adds hidden costs.
Sixty-one percent of business and tech leaders report rising pressure from boards and regulators to prove AI's ROI. Cost attribution answers that question. Observability systems log tokens consumed per request, multiply by provider rates, and aggregate by dimension. With this data, you can optimize prompt templates, cap session budgets, or throttle expensive operations before they drain accounts.
Evaluation vs monitoring: when to use each approach
Real-time observability and monitoring is great for production environments. It detects drift, anomalies, and real-world failures that test datasets never anticipated. But what about before release? For those instances, you can rely on off-line evaluation frameworks to assess agents. Evaluation runs offline on fixed test datasets before deployment. It validates model quality, safety, and performance in controlled environments where you test specific scenarios, edge cases, and adversarial inputs.
Use LLM evaluation platform to catch regressions before release. Use monitoring after deployment to track how LLMs behave with actual users. Both are required: evaluation guards the gate, monitoring guards the outcome.
Open source vs commercial observability tools
Open source tools like Langfuse, Phoenix, and OpenTelemetry offer control over data and infrastructure. You host traces internally, customize evaluation logic, and avoid vendor lock-in. The tradeoff is deployment complexity, limited out-of-the-box tests, and ongoing maintenance burden.
Commercial solutions, though, provide managed infrastructure, prebuilt test libraries, security guardrails, and compliance mapping. You skip setup overhead but accept data egress and subscription costs. Data governance becomes a procurement question: can the vendor meet your residency and privacy requirements?
In either case, you might use a combination of the two, favoring open-source for pre-production environments, and commercial services (which can provide the distributed infrastructure at scale) for agents in production. Your choice here doesn't have to be an either/or.
Best practices for implementing LLM observability
Now that you have a sense of how LLM observability works, what to look for, and how to balance pre-production and production environments, let's look at some best practices:
- Start instrumenting during development, not after deployment. Embed telemetry in your first prototype so traces flow from local testing through staging into production. This captures baseline behavior before users arrive and makes rollback decisions data-driven instead of reactive.
- Define KPIs that tie model behavior to business outcomes with a GenAI testing platform. Track conversion rates alongside hallucination scores, support ticket volume alongside latency, and retention metrics alongside toxicity rates. Technical metrics alone miss the point.
- Integrate observability into CI/CD pipelines. Run your test suite on every commit. Block deployments when must-pass tests fail. This gates releases behind quality thresholds and prevents regressions from reaching production.
- Create separate evaluation and monitoring windows. Run deep evaluations on sample batches to measure groundedness, bias, and adversarial robustness. Run lightweight monitoring on every production request to track latency, errors, and guardrail triggers.
- Build feedback loops between production and development. Route flagged outputs back to your test datasets. When monitoring catches a hallucination, add it to your regression suite. When users report failures, create test cases that reproduce the issue.
How Openlayer accelerates AI observability and governance
Openlayer unifies evaluation and monitoring with a single test library that runs across development and production. Over 100 prebuilt tests validate hallucinations, bias, groundedness, and context relevancy during CI/CD, then execute continuously on live traffic. Real-time guardrails block prompt injections and PII leakage before they reach users. Compliance mapping aligns projects to EU AI Act, NIST RMF, and ISO 42001 requirements without manual documentation. Teams catch regressions in pipelines and detect drift within hours of deployment.
Final thoughts on production AI observability
You can't fix what you can't measure, and LLMs generate failures that traditional monitoring misses entirely. Open source LLM observability and commercial solutions both track hallucinations, retrieval quality, and security risks, but integration complexity varies. Define KPIs that tie model behavior to business outcomes so technical metrics connect to retention and support costs. Schedule a demo to see how prebuilt tests and real-time guardrails work across your stack. The teams succeeding with production AI instrument early, test continuously, and route production failures back into regression suites.
FAQ
What metrics should you track first when implementing LLM observability?
Start with hallucination rates, latency per request, and cost per session. These directly impact user experience and budget. Add groundedness scores for RAG systems and PII exposure rates if handling sensitive data, then expand to semantic drift and context relevancy as your system matures.
How does observability for RAG systems differ from standard LLM monitoring?
RAG observability tracks three additional layers: whether retrieved documents relate to the query (context relevancy), whether the model used those documents correctly (context utilization), and whether responses stay grounded in source material (groundedness). Standard LLM monitoring only measures generation quality without validating retrieval accuracy.
When should you use evaluation versus monitoring for your LLM system?
Run evaluation offline during development on fixed test datasets to catch regressions before release. Deploy monitoring continuously on live production traffic to detect drift and real-world failures that test sets never anticipated. Both are required: evaluation prevents bad deployments, monitoring catches production issues.
Can open source observability tools meet enterprise compliance requirements?
Open source tools provide control over data residency and infrastructure, but require a lot of deployment and maintenance effort. For regulated industries needing automated compliance mapping to frameworks like EU AI Act or NIST RMF, commercial platforms deliver audit-ready workflows and prebuilt guardrails that open source tools lack.