AI Fairness Metrics: A Complete Guide for Enterprise ML Teams in June 2026
When your model scores 92% accuracy in testing, that number hides whether performance is distributed equally across demographic groups. AI fairness metrics surface the gaps aggregate accuracy obscures by measuring outcomes separately for race, gender, age, and other protected attributes. A recidivism model might perform well on average while flagging one group as high-risk at rates that don't match actual reoffense patterns, and regulators increasingly treat that kind of disparity as a compliance failure instead of a modeling edge case. With the EU AI Act's August 2026 enforcement deadline for high-risk systems, fairness metrics in AI have moved from academic interest to binding pre-deployment gates that require documented thresholds, explainability, and live monitoring across the model's entire lifecycle.
TLDR:
- Fairness metrics check whether AI models treat demographic groups equally, catching bias that aggregate accuracy hides.
- Demographic parity, equalized odds, and calibration cannot all hold simultaneously when base rates differ across groups.
- The EU AI Act requires high-risk systems to document fairness metrics before deployment by August 2026.
- IBM AIF360 covers over 70 fairness metrics per its published documentation; Microsoft Fairlearn handles constraint-based mitigation.
- Openlayer tracks fairness metrics as live inference streams, flags demographic parity gaps above configurable thresholds, and logs every calculation for audit retrieval.
What are AI fairness metrics and why they matter
AI fairness metrics are quantitative measures that determine whether an AI system produces equitable outcomes across demographic groups. Where standard accuracy metrics ask how often a model is right on average, fairness metrics ask whether that performance holds equally across race, gender, age, or other protected attributes. A credit scoring model might reach 90% accuracy in aggregate while misclassifying one group at twice the rate of another.
That gap matters because aggregate accuracy hides distributional harm. A model that looks fine on a holdout set can still systematically disadvantage a specific group at a rate that triggers regulatory scrutiny or causes real-world harm at scale.
Why enterprise ML teams can't rely on accuracy alone
There are three reasons fairness metrics have moved from academic interest to production requirement.
- Regulatory pressure is now concrete. The EU AI Act classifies credit scoring, employment screening, and benefits eligibility as high-risk applications with an August 2026 compliance deadline. These systems must document and measure fairness across protected attributes before deployment, not after an incident surfaces.
- Aggregate metrics obscure subgroup failure. A model trained on historically biased data can inherit and amplify those patterns while still posting strong overall numbers. Fairness metrics expose the disparity that accuracy hides.
- Production drift compounds the problem. A model that passes fairness checks at launch can degrade unevenly across groups as input distributions shift, making ongoing monitoring as important as pre-deployment evaluation.
Demographic parity: When equal outcomes are the goal
Demographic parity asks a simple question: does the model produce positive outcomes at the same rate across different demographic groups? If a hiring model approves 70% of applications from one group but only 45% from another, it fails this metric regardless of whether individual predictions are accurate.
The formal definition is straightforward. A classifier satisfies demographic parity when the probability of a positive prediction is independent of group membership, written as P(Ŷ = 1 | A = 0) = P(Ŷ = 1 | A = 1), where A represents the protected attribute.
When demographic parity is the right choice
Demographic parity fits situations where equal representation in outcomes is the goal beyond equal treatment of similar individuals. Hiring, loan approvals, and content recommendation at scale are common contexts where regulators and ethics committees often expect outcome parity as a baseline.
But the metric has real limits worth naming directly before your team builds around it.
- Conflict with accuracy: Demographic parity can conflict with accuracy when the base rates of a target variable genuinely differ across groups. Forcing equal approval rates may require accepting worse predictions for some groups.
- No individual fairness guarantee: It says nothing about whether individuals with similar qualifications are treated similarly. Two models can both satisfy demographic parity while disagreeing completely on which specific individuals receive positive outcomes.
- Intersectional gaps: Satisfying parity on one protected attribute does not carry over to intersectional subgroups. A model balanced by gender and by race separately can still show substantial disparity for women of a specific racial group.
In practice, demographic parity works best as a threshold check instead of a sole optimization target. The EEOC's four-fifths rule, the most widely applied legal standard for adverse impact in hiring and lending, flags a selection rate disparity whenever one group's approval rate falls below 80% of the highest group's rate. For most enterprise models, that translates to a 5 percentage point gap as a practical alert threshold, the same figure Openlayer enforces as a default deployment gate for demographic parity violations. When a model crosses that line, the next step is investigating whether the gap reflects a data artifact, a labeling problem, or a genuine structural issue in the training distribution.
Equalized odds: Balancing error rates across groups
Equalized odds is one of the more demanding fairness criteria you'll encounter. Where demographic parity asks whether outcomes are distributed equally across groups, equalized odds asks whether the model makes equally accurate decisions across groupswhether true positive rates and false positive rates are consistent.
Formally, a model satisfies equalized odds when, for every possible outcome value, the probability of that outcome given group membership is identical across protected groups. In practice, that means a credit model shouldn't be more likely to incorrectly deny qualified applicants from one demographic than another, and shouldn't be more likely to approve unqualified applicants from one group than another.
There are two components worth separating out here.
Equal opportunity vs. equalized odds
Equal opportunity is the weaker condition: it requires only that true positive rates match across groups. Equalized odds is stricter, requiring both true positive rates and false positive rates to match.
The tradeoff is real. Enforcing equalized odds often reduces overall accuracy because the model must balance error rates across groups that may have different base rates. A hiring model with equalized odds might flag more candidates overall to keep false negative rates consistent across demographic groups, accepting a precision cost to meet the fairness constraint.
When to apply which:
- Use equal opportunity when false negatives carry the primary harm, such as in loan approvals or medical screenings where missing a qualified candidate or patient has the most serious consequence.
- Use equalized odds when both error types carry real consequences, such as in recidivism risk scoring or fraud detection, where both false positives and false negatives have measurable downstream impact on real people.
A useful numeric check: if your false positive rate for one group exceeds another by more than 3 percentage points, that gap warrants investigation before deployment. That specific threshold appears in published fairness audit practice, including Berk et al.'s COMPAS analysis, and aligns with the deployment gate Openlayer enforces by default for equalized odds violations.
Additional core metrics: Equal opportunity, predictive parity, and calibration
Equal opportunity, predictive parity, and calibration each fill gaps that demographic parity and equalized odds leave open. Together, they give ML teams a fuller picture of where a model may be treating groups differently.
There are three metrics worth understanding here:
- Equal opportunity: asks whether the true positive rate is consistent across groups. Formally, it requires P(Ŷ=1 | Y=1, A=0) = P(Ŷ=1 | Y=1, A=1): the model should recall qualified individuals at the same rate regardless of group membership. A hiring model evaluation might meet demographic parity on callbacks while still surfacing qualified candidates from one group at a much lower rate. Equal opportunity catches that gap. A practical threshold: if the true positive rate for one group falls more than 5 percentage points below another, that gap warrants investigation before deployment. One limitation worth naming directly: equal opportunity says nothing about false positive rates. A model that satisfies it can still flag unqualified applicants from one group at disproportionate rates, which is why it often pairs with equalized odds in high-stakes applications where both error types carry real consequences.
- Predictive parity: asks whether a positive prediction means the same thing across groups. The formal measure is positive predictive value (PPV): if a model flags 100 loan applicants as high-risk, predictive parity checks whether the same fraction of flagged individuals actually default across demographic groups. If the model flags Group A applicants at 80% precision but Group B applicants at only 55% precision, a high-risk flag carries materially different weight depending on group membership. That asymmetry can compound downstream: when high-risk flags trigger manual review, Group B applicants face more scrutiny per actual default than Group A applicants do. A useful numeric check: a PPV gap larger than 5 to 8 percentage points across groups signals that the model's training distribution may over-represent certain groups in the high-risk label. Predictive parity and equal opportunity can conflict when base rates differ across groups, so satisfying one can move the other in the wrong direction.
- Calibration: asks whether predicted probabilities reflect actual outcomes at the same rate across groups. A recidivism model might assign a 70% risk score to defendants from two different groups, but if that score corresponds to a 70% reoffense rate in one group and only 50% in another, the model is miscalibrated across demographic lines. Measuring calibration requires subgroup-level reliability curves or expected calibration error (ECE) computed separately for each protected attribute. A well-calibrated model keeps ECE below 5% within each subgroup; a gap of more than 5 to 10 ECE points across groups is a meaningful signal of differential reliability. What calibration catches that the other metrics miss: a model can satisfy both demographic parity and equal opportunity while still being miscalibrated for a specific subgroup, meaning its probability outputs carry different informational value depending on who the subject is.
Why these three metrics rarely align simultaneously
A result known as the impossibility theorem in algorithmic fairness, independently by Chouldechova (2017) and Kleinberg et al. (2016), shows that demographic parity, equalized odds, and calibration cannot all be satisfied at the same time when base rates differ across groups. In practice, optimizing for one metric will move others in the wrong direction.
That tradeoff is not a reason to avoid measurement. It is the reason to be deliberate about which metric your use case demands before you start tuning, not after.
The impossibility theorem: Why you cannot satisfy all metrics at once

A result known as the impossibility theorem in algorithmic fairness, proved independently by Chouldechova (2017) and Kleinberg et al. (2016), shows that three intuitive fairness properties cannot all hold simultaneously except in degenerate cases. The three properties are calibration (predicted probabilities match actual outcomes within groups), balance for positive class (similar false negative rates across groups), and balance for negative class (similar false positive rates across groups). Recent work revisiting the impossibility theorem shows these tradeoffs remain foundational to algorithmic fairness practice.
This creates real tension for enterprise ML teams. A credit scoring model calibrated separately for demographic groups will almost certainly produce different false positive rates across those groups. A hiring algorithm equalized for false rejection rates will likely show miscalibration.
You cannot optimize all three at once without either perfect prediction accuracy or equal base rates across groups, and neither condition holds in real-world data. Four specific conflicts come up repeatedly in practice:
There are four primary conflicts that practitioners run into repeatedly:
- Demographic parity vs. predictive parity: equalizing approval rates across groups often requires accepting different positive predictive values, meaning the model's confidence in a positive prediction carries different weight depending on group membership.
- Equalized odds vs. calibration: achieving equal true positive and false positive rates across groups is mathematically incompatible with well-calibrated probabilities when base rates differ across those groups.
- Individual fairness vs. group fairness: when similar individuals receive similar predictions, that can actively conflict with group-level statistical parity goals, particularly when group membership aligns with features.
- Short-term vs. long-term fairness: a metric that looks balanced at deployment can produce feedback loops that worsen disparity over time, as model outputs influence future training data.
The practical implication is that choosing fairness metrics is a values decision, not a technical one. Teams must decide which errors are most costly for which populations, and that decision should be made explicitly before training begins, with input from legal, ethics, and domain experts, not reverse-engineered from whatever metric happens to score well.
Fairness metrics in financial services: Credit scoring and lending
Financial services sits at the sharpest end of AI fairness risk. Credit scoring and lending decisions affect access to housing, capital, and economic mobility, which is why regulators treat algorithmic bias here with far less tolerance than in most other sectors.
There are three fairness metrics that matter most in this context.
Demographic parity in credit approval rates
Approval rates should not vary by protected class unless a legitimate, documented risk factor explains the gap. A model that approves 72% of white applicants and 54% of Black applicants with comparable credit profiles is failing demographic parity, regardless of whether that gap was intentional.
Equal opportunity across default prediction
Lenders need their models to predict default risk with equal accuracy across groups. If a model's false negative rate, approving borrowers who later default, is systematically higher for one demographic, that group carries more exposure. If the false positive rate is higher, qualified borrowers in that group get rejected at disproportionate rates.
Calibration by subgroup
A well-calibrated model assigns a 20% default probability to borrowers who actually default 20% of the time, and that relationship should hold across race, gender, and age cohorts. Miscalibration that clusters in a specific group is a fairness failure beyond a model quality issue.
One hard constraint applies here: in the US, the Equal Credit Opportunity Act and Fair Housing Act create legal exposure for disparate impact, meaning measurable outcome gaps can trigger regulatory action even without discriminatory intent.
EU AI Act requirements for fairness in high-risk systems
The EU AI Act classifies certain AI applications as high-risk, and systems that make consequential decisions about people fall squarely into that category. Credit scoring, hiring tools, educational assessment, and benefits eligibility systems all carry binding fairness obligations under the Act's Annex III provisions.
For teams building or deploying these systems, the regulatory requirements translate into three concrete obligations.
Documentation and bias testing before deployment
High-risk systems must undergo conformity assessments that include bias evaluation across protected characteristics before any deployment. Your fairness metrics need to be computed, recorded, and reviewable before a model goes live, not after an incident surfaces a problem.
Ongoing monitoring in production
The Act requires continuous monitoring of high-risk systems throughout their lifecycle in production. A fairness evaluation that passes at deployment is not a permanent clearance. Teams must track demographic parity gaps, equalized odds violations, and similar metrics in production, with defined thresholds that trigger review. For instance, a deployment gate might block a model if the demographic parity gap exceeds 5% between any two protected groups.
Human oversight and explainability requirements
High-risk systems must support meaningful human oversight, which in practice means your fairness outputs need to be interpretable by reviewers who are not ML engineers. Counterfactual explanations and individual fairness scores serve double duty here: they satisfy the explainability requirements while giving compliance reviewers the evidence trail they need for audit.
The August 2026 deadline for high-risk financial services obligations is the nearest hard date for most enterprise ML teams. Systems already in production need retroactive conformity documentation alongside forward-looking monitoring plans.
Choosing the right metric for your use case
No single fairness metric works across every context. The right choice depends on what kind of harm your model can cause and who bears it.
Start with the harm model. Ask whether errors are symmetric, meaning a false positive and false negative carry equal weight, or asymmetric, where one error type causes meaningfully more damage. In lending, a false denial harms the applicant directly. In recidivism scoring, a false positive restricts someone's freedom. Those aren't equivalent, and equal overall accuracy masks the gap.
From there, three heuristics help narrow the field:
- When group-level representation matters more than individual outcomes, demographic parity is the right starting point. It surfaces systemic over- or underrepresentation quickly, even if it says nothing about why that gap exists.
- When error rates across groups are your concern, equalized odds gives you the full picture by checking both false positive and false negative rates simultaneously without trading one off against the other.
- When the model's outputs are used to rank or score individuals who will compare their results directly, individual fairness becomes relevant. Two applicants with near-identical profiles should receive near-identical scores.
Keep in mind that fairness criteria are mathematically incompatible in most real settings. Satisfying demographic parity and equalized odds at the same time is only possible when base rates are equal across groups, which is rarely true in practice. So the choice is both technical and normative; it reflects a judgment about whose outcomes your team is accountable for.
Document that judgment explicitly. Regulators and auditors increasingly expect teams to show which metric was tracked and why it was selected given the deployment context.
Open source tools for fairness measurement

Three libraries cover most of what teams need without building metrics from scratch.
| Library | Core coverage |
|---|---|
| IBM AIF360 | Over 70 metrics per AIF360's published documentation, including statistical parity difference, equal opportunity difference, average odds difference, and disparate impact; includes bias mitigation algorithms for preprocessing, in-processing, and postprocessing |
| Microsoft Fairlearn | Constraint-based mitigation via reductions and postprocessing; built-in dashboard for visualizing disparity across demographic slices |
| Google What-If Tool | Interactive model inspection across subgroups; counterfactual analysis; integrates with TensorFlow and Scikit-learn |
The AIF360 open source library is the most metric-complete of the three and the natural starting point if your team needs a broad measurement baseline before deciding which metrics to track or enforce. Fairlearn is stronger on the mitigation side, particularly when you've already identified a disparity and want to apply a reductions approach without writing constraint logic by hand. The What-If Tool sits closer to the exploratory end, useful for auditing model slices interactively before committing to a specific metric framework.
Measuring fairness in production: Openlayer's continuous monitoring approach
Fairness gaps that appear in offline evaluation often look very different once a model hits real traffic. Class distributions shift, new demographic subgroups enter the user base, and edge cases accumulate in ways that static test sets never anticipated. Catching those gaps requires continuous measurement in production, not a one-time audit before launch.
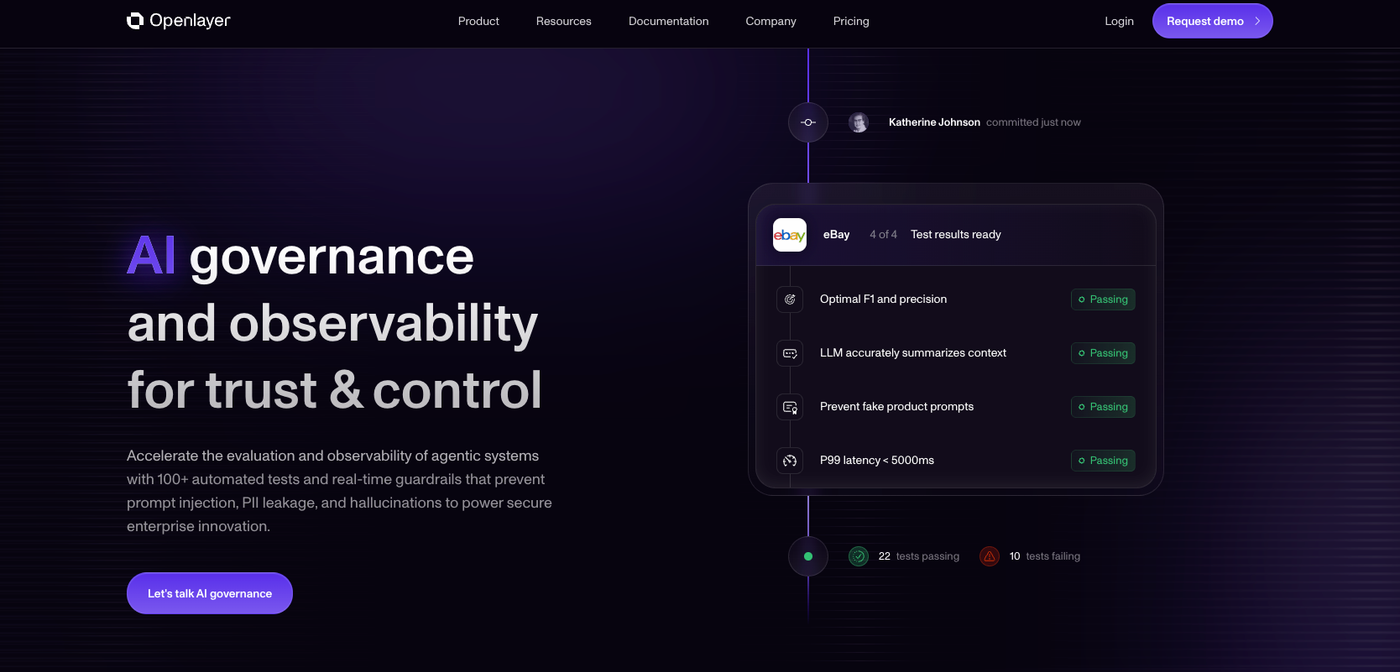
Openlayer's monitoring layer tracks AI fairness metrics as live inference streams instead of batch snapshots. As predictions flow in, the system calculates group-level performance metrics across protected attributes, flags disparity spikes when demographic parity gaps exceed configurable thresholds, and ties every alert back to the specific slice of data driving the divergence. That last detail matters: knowing a fairness metric degraded is far less useful than knowing which subgroup, which feature range, and which input pattern caused it.
There are a few specific capabilities worth understanding here.
Slice-level monitoring across protected attributes
Openlayer segments incoming predictions by declared sensitive attributes and computes per-slice accuracy, false positive rate, false negative rate, and calibration continuously. If a credit-scoring model's false positive rate for one demographic segment drifts more than 3 percentage points above the baseline, an alert fires before the disparity compounds across thousands of decisions.
Policy-enforced deployment gates
Fairness thresholds are enforced gates in Openlayer, not monitoring dashboards. A model promotion blocked because equalized odds violation exceeds the team's defined tolerance never reaches production. The threshold is set once in policy; enforcement is automatic.
Audit-ready evidence trails
Every fairness metric calculation is logged with the model version, evaluation timestamp, input slice definition, and threshold configuration. When a compliance review asks for evidence that your hiring model met demographic parity standards over the past quarter, that record exists and is retrievable without reconstructing it manually.
Final thoughts on implementing fairness checks before deployment
The right fairness metric depends on which kind of harm your model can cause and who bears the consequences. Demographic parity surfaces representation gaps, equalized odds balances error rates, and calibration checks whether your model's confidence means the same thing across groups. You can't satisfy all three when base rates differ, so document which one you're tracking and why before regulators ask. If you need fairness thresholds enforced as deployment gates instead of post-launch dashboards, talk to us.
FAQ
Can I measure fairness in production without slowing down inference?
Yes. Openlayer calculates fairness metrics on live inference streams instead of batch snapshots, tracking demographic parity gaps, false positive rates, and other group-level performance metrics continuously as predictions flow in. Configurable sampling policies let you run resource-intensive evaluations on representative subsets of production data instead of full volume, so governance scales without linear cost or latency impact.
AI fairness metrics demographic parity vs equalized odds?
Demographic parity measures whether positive outcomes occur at the same rate across groups, regardless of whether individuals are similarly qualified. Equalized odds is stricter: it requires both true positive rates and false positive rates to match across groups so the model makes equally accurate decisions for each demographic. Use demographic parity when equal representation in outcomes matters most, and equalized odds when both error types carry real consequences for real people.
What fairness metrics should I track for credit scoring models?
Track three metrics for credit scoring: demographic parity to confirm approval rates don't vary by protected class without documented risk factors, equal opportunity to verify the model predicts default risk with equal accuracy across groups, and calibration by subgroup to confirm that a 20% default probability means 20% actual default rate across all demographic cohorts. The Equal Credit Opportunity Act and Fair Housing Act create legal exposure for measurable outcome gaps even without discriminatory intent.
How do I choose which fairness metric to enforce at deployment?
Start with the harm model: determine whether errors are symmetric or asymmetric, meaning whether false positives and false negatives carry equal weight. For asymmetric harm like loan denials or recidivism scoring where one error type causes meaningfully more damage, choose equalized odds. For contexts where group-level representation matters more than individual outcomes, demographic parity is the right starting point. Document your choice explicitly before training begins, because fairness criteria are mathematically incompatible in most real settings and regulators expect teams to explain which metric was selected given the deployment context.
When does the EU AI Act require fairness documentation for AI systems?
High-risk AI systems under the EU AI Act, including credit scoring, hiring tools, and benefits eligibility systems, must undergo conformity assessments that include bias evaluation across protected characteristics before any deployment. The August 2026 deadline applies to high-risk financial services obligations, and systems already in production need retroactive conformity documentation plus continuous monitoring in production with defined thresholds that trigger review when fairness metrics degrade.