AI Observability Explained: February 2026
Good observability is more than just a nice dashboard—it helps you catch, debug, and solve issues quickly. Yet, AI applications introduce complexities that traditional observability tools were not built to handle.
This post breaks down why observability is a must-have for any serious application and what makes AI observability special. Furthermore, it shows you how to set it up using a specialized platform, and how to leverage OpenTelemetry for flexible, vendor-agnostic observability.
The need for observability
Before diving into the tools you can use to observe your AI application, it is valuable to take a step back and understand why observability matters.
In short, observability helps you see what’s going on inside your application without needing to stop it and take it apart. This is helpful because unexpected issues happen more often than anyone would like to admit. When they occur, you can refer to your application traces, metrics, and logs to understand what happened and take corrective action.
If you ship an application without observability, you are in the dark. First, you might not even know when issues occur—you would need to rely on your users notifying you when they see something strange. Second, when it comes time to fix the problems, you would be starting from scratch. You would need to figure out what data triggered them, which parts of the code need to be fixed, who was affected, and so on.
What makes AI observability special
There are a few characteristics that make AI observability special if compared to traditional software systems.
Traditional software is rule-based and deterministic. A software engineer explicitly writes each line of code with an intended behavior in mind. Consequently, once the software is shipped, it is expected to work as planned.
This expectation is rarely met in practice. Unanticipated bugs happen, which is one of the reasons to observe these systems. Other reasons range from scalability concerns to security issues.
Now, what makes AI applications different?
AI applications are also built with code. This means that they are prone to every issue that occurs in the traditional software realm. In fact, many problems with AI systems happen because of causes unrelated to AI.
However, the way AI models are built introduces an additional layer of complexity to the problem. AI models are not rule-based and deterministic, as traditional software is; they learn patterns from data and are then deployed to extrapolate those patterns in the real world.
Since the data the model will be exposed to in production will inevitably be different from the data it was trained and validated on, some unexpected behaviors are unavoidable.
Moreover, considering that AI applications typically make calls to external APIs that incur costs (e.g., calls to OpenAI), and are built around emerging patterns (e.g., retrieval augmented generation (RAG), agents), having an observability setup that takes these into consideration is paramount.
Setting up AI observability
By now, you should be convinced that it makes sense to observe your AI applications. The next question is: how do you set it all up?
Setting up observability usually involves two steps:
1. Instrumenting your application code to capture the data that goes through it.
2. Exporting the captured data to an AI observability platform.
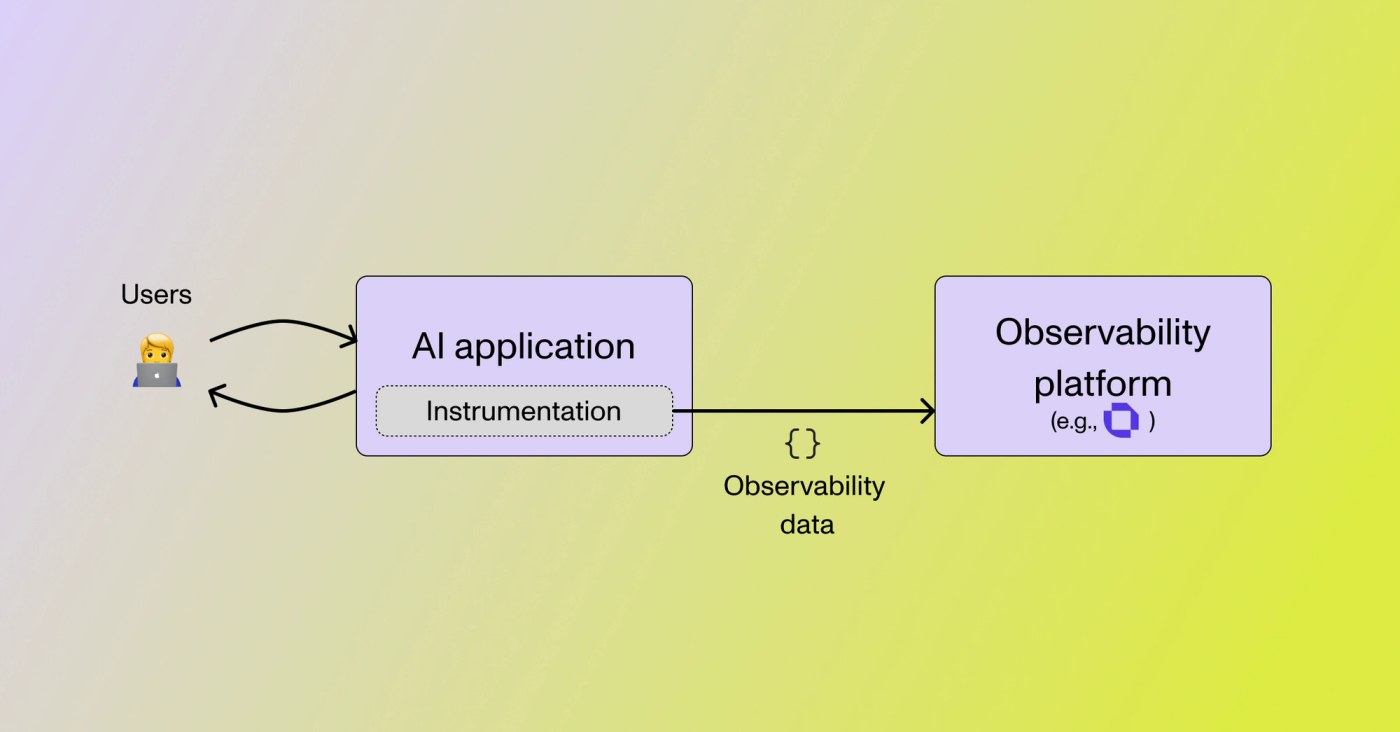
A specialized AI observability platform is recommended. Building your own solution to store data from the instrumentation code might be fine at first, but it quickly becomes a time-sink as your application grows. A platform not only handles large volumes of data but also offers features well beyond visualization, such as metrics, tests, alerts, and others. Plus, having a single source of truth is crucial if you have many people—or even many teams—working on AI applications.
To illustrate steps 1 and 2, let’s say we have a RAG application written in Python and want to use Openlayer monitoring mode as our observability platform.
To implement step 1, we would go to our Python code where the RAG pipeline is defined, and instrument it with a few functions and decorators from the Openlayer Python SDK. These lines of code are responsible for capturing the inputs, outputs, and metadata that go through our system when our users use it. This is the role of the trace decorators and the trace_openai function in the code snippet below.
The environment variables on the top are responsible for step 2. They tell the Openlayer SDK where to export the captured data to. In this case, it should be exported to the Openlayer account identified by the API key and, within that account, to the pipeline with the specific id.
Our instrumented code would look similar to the snippet below:
import openai
from openlayer.lib import trace, trace_openai

# Make sure to set the following env variables:
# OPENLAYER_API_KEY=YOUR_OPENLAYER_API_KEY
# OPENLAYER_INFERENCE_PIPELINE_ID=YOUR_OPENLAYER_PIPELINE_ID


# Wrap the OpenAI client Openlayer's `trace_openai`
openai_client = trace_openai(openai.OpenAI())

# Decorate all the functions you want to capture inputs/outputs/metadata
@trace()
def main(user_query: str) -> str:
    contexts = retrieve_contexts(user_query)
    prompt = prepare_prompt(user_query, contexts)
    answer = generate_answer(prompt)
    return answer

@trace()
def retrieve_contexts(user_query: str) -> str:
    """Returns the top-k contexts."""
    return ["Some context"]

@trace()
def prepare_prompt(user_query: str, contexts: List[str]) -> List[Dict[str, str]]:
   """Prepares the prompt combining the user query and contexts."""
   return [{"role": "user", "content": user_query + contexts}]

@trace()
def generate_answer(prompt: List[Dict[str, str]]) -> str:
    """Generates the answer with the LLM"""
    result = openai_client.chat.completions.create(
        messages=prompt,
        model="gpt-4o"
    )
    return result.choices[0].message.content
(A Google Colab notebook similar to the example above can be found here.)
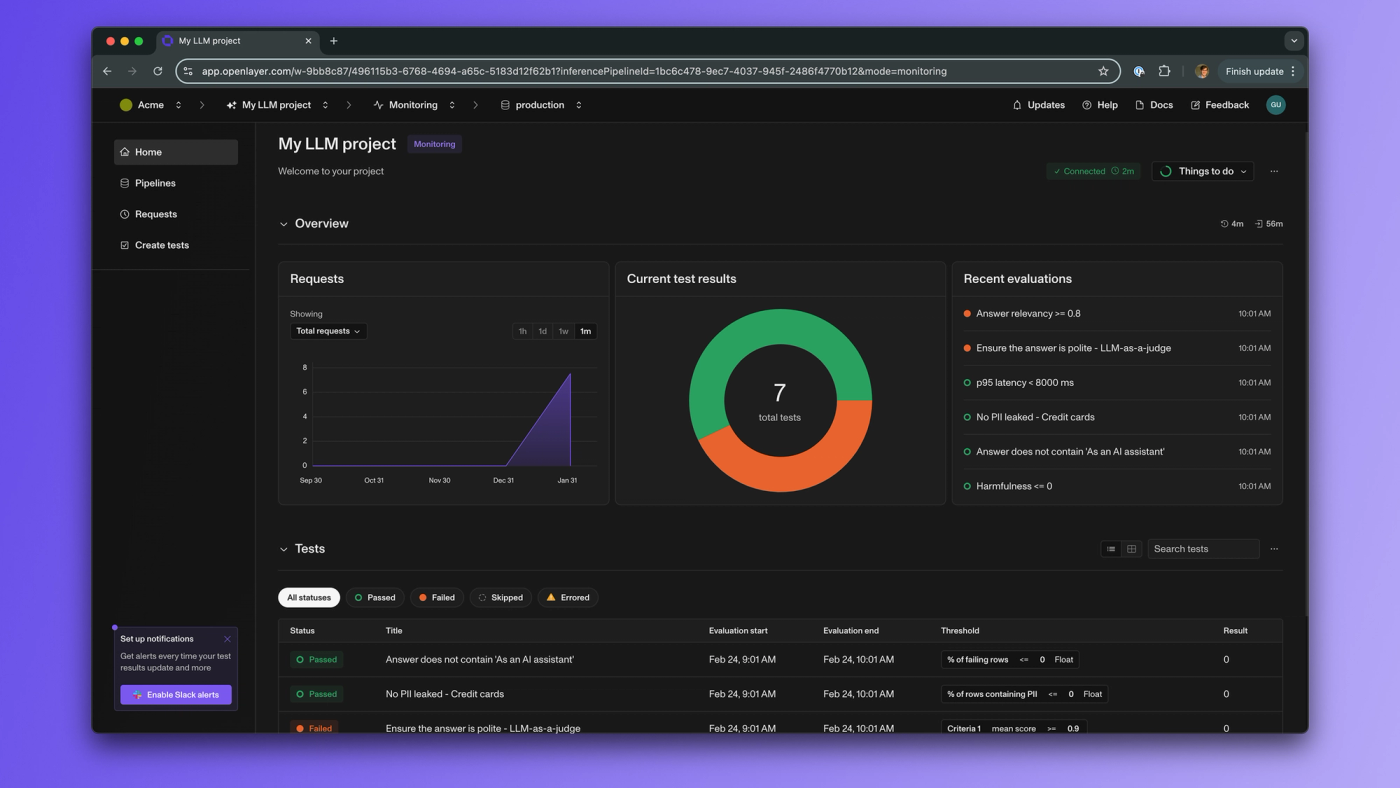
Once the code above serves live user requests, the full traces are sent to the Openlayer platform.
The trace information alone is already valuable. You can see how users interact with your application and understand what went into each request. You can also annotate and export the data to your validation or fine-tuning datasets.
That said, AI observability platforms shine when they leverage trace data to provide a comprehensive view of system health. For example, on Openlayer you can keep track of metrics and create tests your system must continually pass.
The relevant metrics and tests are use-case-specific. For our RAG example, we might want to keep track of metrics such as faithfulness, context recall, response latency, cost, and others—essentially anything that indicates whether your pipeline is returning high-quality answers in a timely, cost-effective manner. If you have particular needs, you can also create custom metrics. Automated tests ensure your system continues to perform as expected even as data changes or traffic scales, and the configured alerts notify you immediately if anything happens.
The example above used Openlayer. However, the process tends to be similar for other AI observability platforms. You start by instrumenting the code and then exporting the captured data to a backend.
In the next section, we will explore a slightly different way to observe our AI applications: with OpenTelemetry.
OpenTelemetry for AI observability
OpenTelemetry (OTel) is an open-source framework that can be used to collect observability data. It is built to be vendor-agnostic, which means you can export captured data to many observability platforms and prevents vendor lock-in.
OTel is well-established for traditional software observability. However, we have seen that AI has its own special needs. So, you might be wondering the point of discussing it here.
There are two reasons.
The first one is that at the time of this writing, OTel had a special interest group focused on “Generative AI Observability.” In practice, this means that people are actively discussing standards and conventions for observability data taking into account the specificities of AI.
Second, many popular frameworks used to build AI applications already support OTel. Therefore, if you use one of these frameworks, your code is already instrumented to capture OTel-compatible data behind the scenes. All that is left for you to do is export this data to an observability platform that accepts it.
Examples of popular AI frameworks that are natively instrumented according to OTel are Vercel AI SDK, Spring AI in Java, Traceloop, and others.
The beauty of OTel in this context is that it allows “turn-key integrations.” For example, if you built your AI application using Vercel AI SDK and want to set up observability with Openlayer, all you need to do is tell the AI SDK to export your telemetry data to Openlayer. This is done with a couple of environment variables:
OTEL_EXPORTER_OTLP_ENDPOINT=https://api.openlayer.com/otel
OTEL_EXPORTER_OTLP_HEADERS="Authorization=Bearer YOUR_OPENLAYER_API_KEY, x-bt-parent=pipeline_id:YOUR_PIPELINE_ID"
That’s it! There’s no need to further instrument your code. Your traces will go straight to Openlayer and you can leverage them to create metrics and tests.
A final comment on OTel for AI applications is that while progress is being made, there are still rough edges. Some frameworks produce data that broadly adheres to the OTel standard but that does not conform fully to the Gen AI attributes semantic convention. On the other hand, the Gen AI semantic convention is currently not expressive enough to capture all the needs of AI applications, which justifies the frameworks coming up with conventions on their own. Consequently, observability platforms might fail to render some part of traces properly.
Despite the minor hiccups, we can expect OTel to evolve alongside AI application needs, which is a win for the community.
Conclusion
AI observability isn’t just a best practice—it’s a necessity for maintaining reliable AI applications in production. Unlike traditional software, AI comes with unique challenges, from model drift to external API dependencies, making specialized observability crucial.
By combining an AI observability platform with OpenTelemetry, you gain both deep insights and the flexibility to integrate with various tools without vendor lock-in. Whether you choose to instrument your code manually or leverage turn-key integrations from frameworks already supporting OTel, the key is to ensure your AI systems are observable from day one.
Ultimately, observability empowers you to move faster and build high-quality AI applications.