
Know how yourAI behavesin production.
Openlayer traces every production request and continuously runs the same evaluations used before deployment, so quality, cost, safety, and compliance remain measurable after launch.
See Openlayer in your stack


 u-B38fgsh
 sess_k7n2m9p4x8w3q6z1
 openAI
 733cf511-6bf1-4e5c-b616-756ac6de7a5e


 PII
PII allowed
 PII
PII blocked
 modified


Production is where AI becomes unpredictable.
In development, teams test against known datasets and controlled scenarios. In production, AI encounters new users, changing inputs, unexpected tool paths, and behavior no pre-launch test can fully anticipate.
Traditional monitoring can tell you whether a system is available. It cannot tell you whether an answer is accurate, an agent made the right decision, or performance is quietly deteriorating across thousands of interactions.
Up is not the sameas working.
An AI system can be online and still hallucinate, leak PII, drift, or quietly burn budget. Traditional application and security monitoring can capture uptime, errors, and network activity, but not whether an AI response was correct, safe, or compliant.
When something goes wrong, engineers are left reconstructing the incident across disconnected logs, model calls, prompts, tool actions, and user sessions.
Behavioral failures are invisible to standard monitoring.
Application monitoring can confirm that a request succeeded without detecting that the answer was inaccurate, unsafe, biased, or off-policy.
No complete record of each AI interaction.
Prompts, responses, latency, token usage, cost, evaluations, tool calls, and user feedback live in separate systems, or are not captured at all.
Pre-launch tests stop at deployment.
A system may pass every evaluation before launch, then encounter new inputs, model updates, changing data, and unexpected agent behavior in production.
One standard from development through production.
Openlayer connects every production trace to the evaluations and policies used before deployment. Teams can continuously verify that each system still meets its requirements, see what changed, and investigate failures without rebuilding tests in another tool.
<1hr
to detect a failed production evaluation
175+
automated tests for quality, safety, performance, and compliance
6x
faster deployment after standardizing on Openlayer
A complete record of production AI behavior
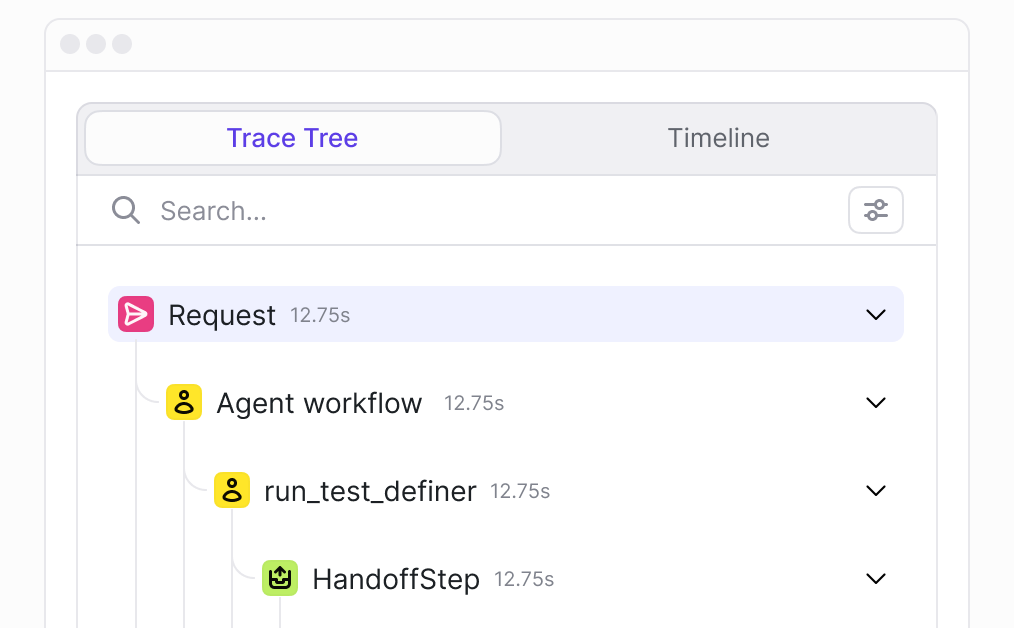
Complete traces for every AI interaction
Capture inputs, outputs, model calls, tool actions, metadata, latency, token usage, cost, evaluations, and user feedback in one queryable trace.
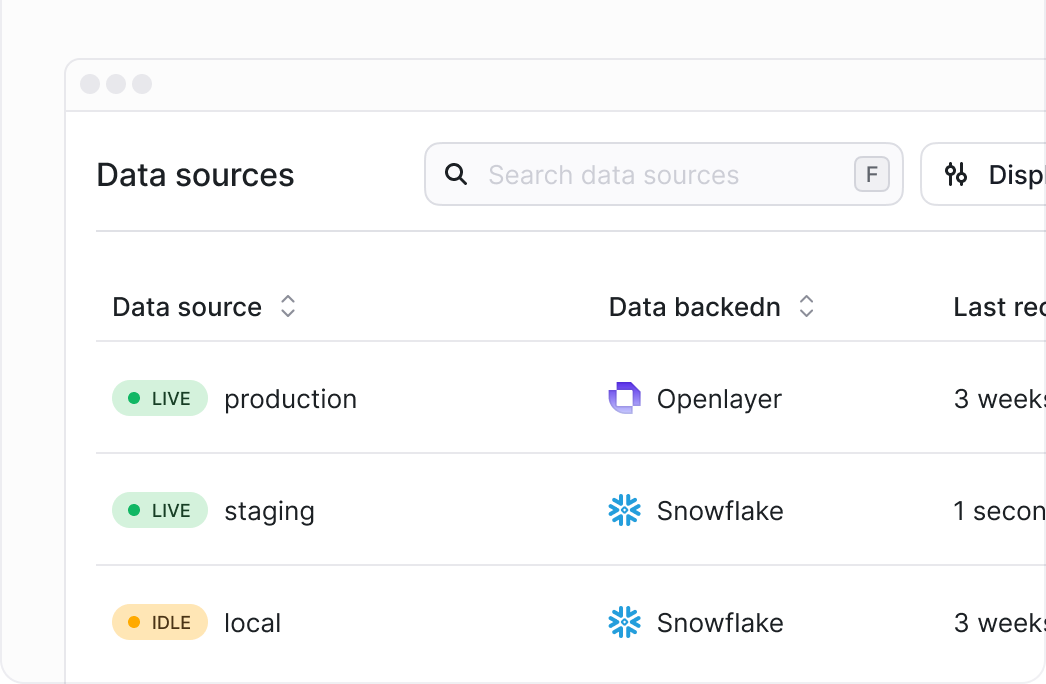
One live feed across every environment
Stream AI interactions from local development, staging, canary, and production into one consistent observability layer.
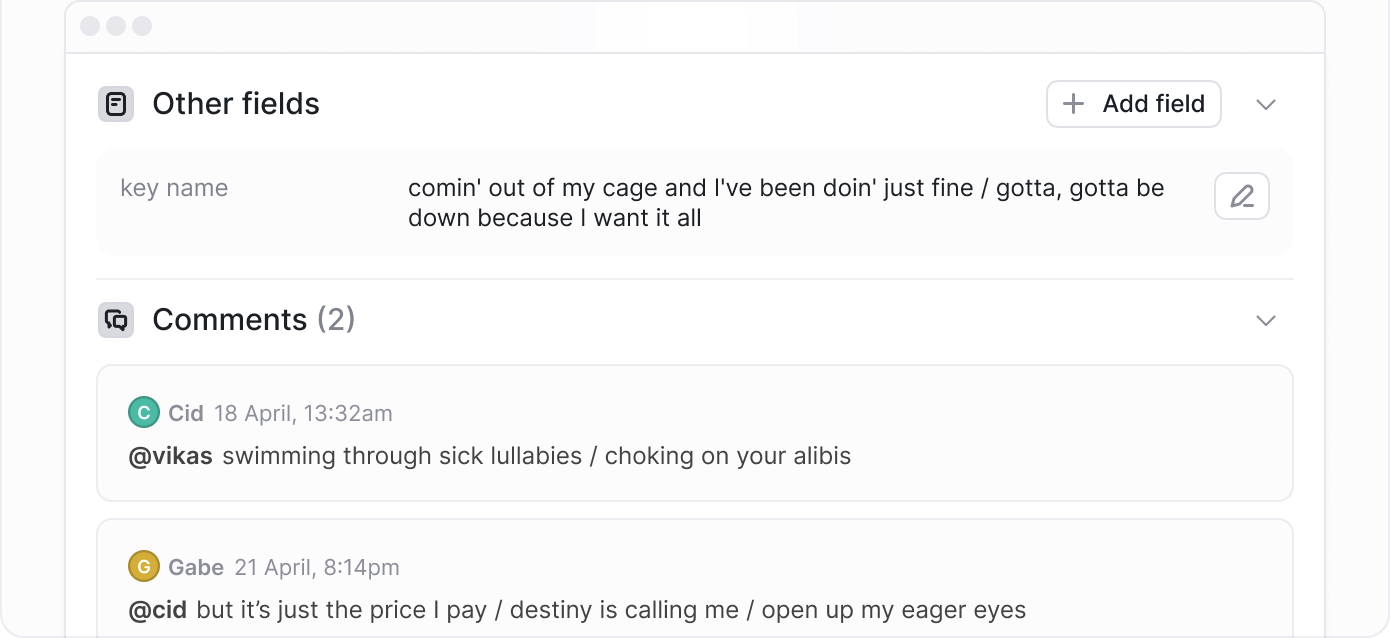
Human feedback and annotation
Capture thumbs-up/down feedback and custom labels, then connect every annotation to the exact session, trace, and model response that produced it.
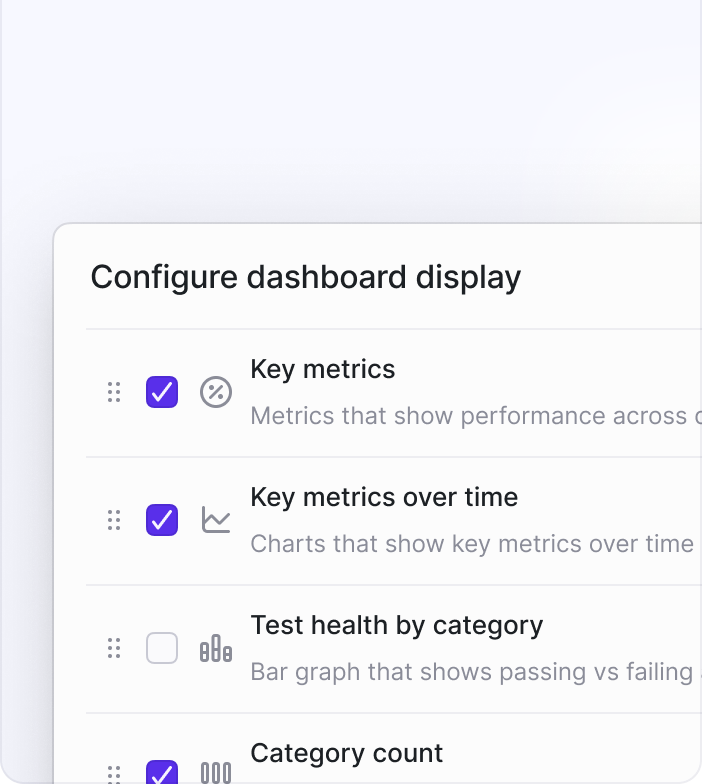
Customizable dashboards
Build dashboards around the quality, cost, latency, safety, and compliance metrics that matter to each team and AI system.
Trusted by regulated leaders: Sun Life and Gallagher (insurance); Rogers, KPN, and Comcast (telecom and media).
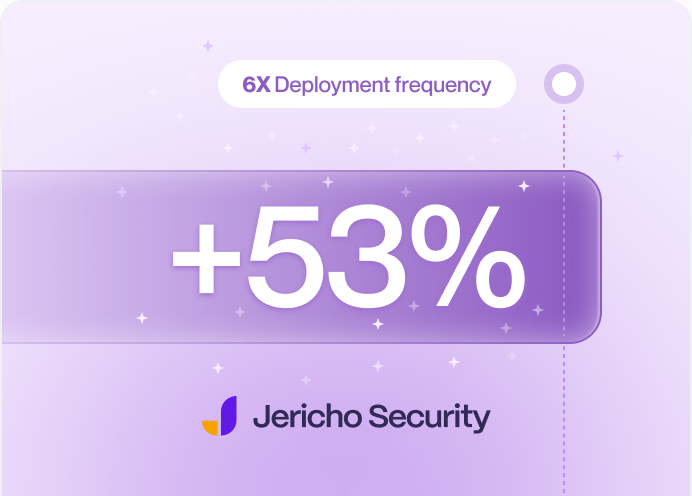
Jericho Security: 6x deployment frequency and +53% throughput after standardizing on Openlayer.

Backed by Y Combinator and Race Capital. SOC 2 Type II.
Founded by ex-Apple/Siri ML engineers.

Named in the 2026 Gartner Market Guide for AI Evaluation and Observability Platforms.

Endorsed by Guillermo Rauch (Vercel CEO) and Max Mullen (Instacart founder).
Monitoring gives continuous visibility into how AI systems behave in production by tracing every request and running the same evaluations used before deployment against live traffic.
Each trace captures the input, the output, every model call and tool action, metadata, latency, token usage, cost, evaluation scores, and any user feedback, all queryable in one place.
Monitoring consolidates AI interactions from development, staging, canary, and production environments into a single observability layer.
Openlayer records human feedback such as thumbs up or down ratings and custom labels, and ties that feedback to the specific session and response it refers to.
Monitoring is designed to surface a failed production evaluation quickly, so a regression, a spike in hallucinations, or a drift in behavior can be caught before it affects a large share of users.
Monitoring is built to catch behavioral failures such as hallucinations, PII leaks, and policy violations that traditional infrastructure monitoring misses, because a system can show healthy uptime while still producing unsafe outputs.
Teams can build customizable dashboards around the metrics that matter to them, whether that is quality, cost, latency, safety, or compliance.
Monitoring includes a library of automated tests for quality, safety, performance, and compliance that can run continuously against live traffic, and teams can add their own checks on top.
Monitoring data doubles as audit evidence, because every trace, evaluation, and policy check is already recorded and available as a defensible history of how a system behaved.
Monitoring observes and evaluates behavior, including within the request itself, while Guardrails intervene in real time to block a specific input or output before it completes. Most teams run both together.