Introducing support for multi-turn interactions. You can now log and refer back to the full chat history of each of your production requests in Openlayer. Sort by timestamp, token usage, or latency to dig deeper into your AI’s usage. And view graphs of these metrics over time.
There’s more: we now support Google’s new Gemini model. Try out the new model and compare its performance against others.
⬇️ Read the full changelog below for all the tweaks and improvements we’ve shipped over the last few weeks and, as always, stay closer to our development journey by joining our Discord!
Features
•ObservabilityLog multi-turn interactions in monitoring mode, and inspect individual production requests to view the full chat history alongside other meta like token usage and latency
•UI/UXSort and filter through your production requests
•ObservabilityView a graph of the token usage and latency across all your requests over time
•IntegrationsSupport for Gemini is now available in-platform: experiment with Google’s new model and see how it performs on your tests
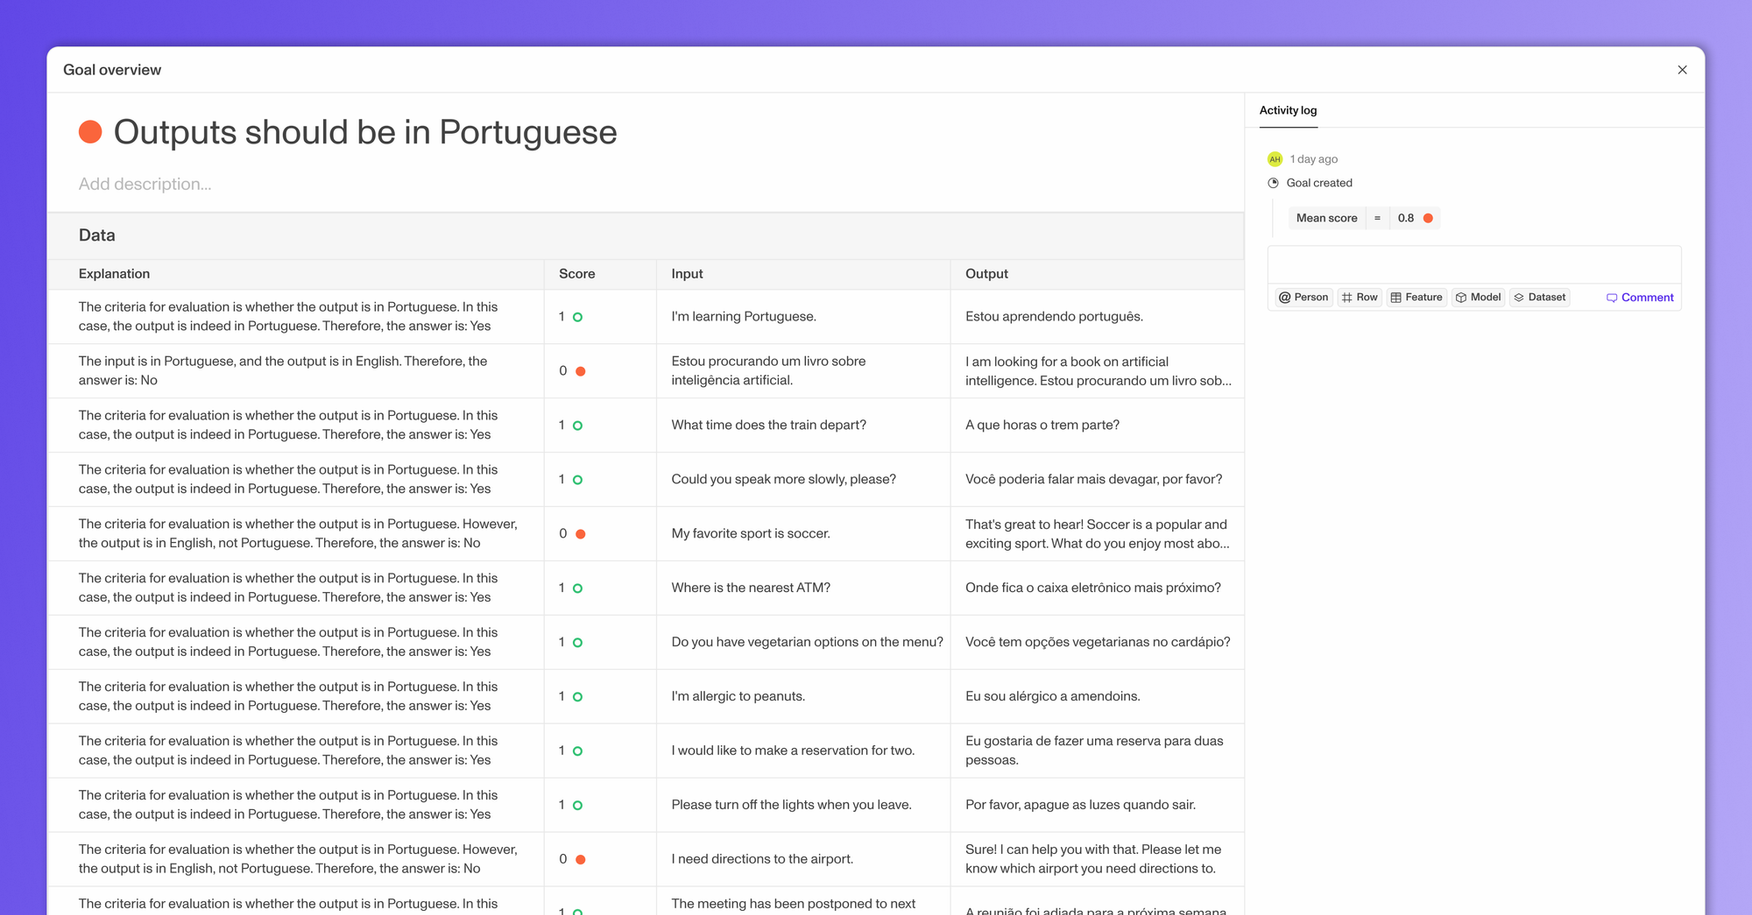
•EvalsView row-by-row explanations for tests using GPT evaluation
Improvements
•SDKsExpanded the Openlayer TypeScript/JavaScript library to support all methods of logging requests, including those using other providers or workflows than OpenAI
•UI/UXImproved commit selector shows the message and date published for each commit
•UI/UXNew notifications for uploading reference datasets and data limits exceeded in monitoring mode
•CollaborationOnly send email notifications when test statuses have changed from the previous evaluation in monitoring
•TemplatesAdded sample projects for monitoring
•UI/UXEnhancements to the onboarding, including a way to quickstart a monitoring project by sending a sample request through the UI
•UI/UXNo longer navigate away from the current page when toggling between development and monitoring, unless the mode does not apply to the page
•UI/UXAllow reading and setting project descriptions from the UI
•UI/UXUpdate style of selected state for project mode toggles in the navigation panel for clarity
•UI/UXClarify that thresholds involving percentages currently require inputting floats
•PlatformAllow computing PPS tests for columns other than the features
•UI/UXTest results automatically update without having to refresh the page in monitoring mode
•UI/UXAdd dates of last/next evaluation to monitoring projects and a loading indication when they recompute
•UI/UXSurface error messages when tests fail to compute
•UI/UXAdd callouts for setting up notifications and viewing current usage against plan limits in the navigation
•UI/UXGraphs with only a single data point have a clearer representation now
•UI/UXImprovements to the experience of creating tests with lots of parameters/configuration
•UI/UXImprovements to the experience of creating tests with lots of parameters/configuration
•UI/UXAdd alert when using Openlayer on mobile
•UI/UXDefault request volume, token usage, and latency graphs to monthly view
Fixes
•UI/UXTitle suggestions for certain tests during creation were unavailable or inaccurate
•UI/UXFixes to test parameters, including incorrectly labeled and invalid options
•UI/UXCertain LLM tests would not allow selecting target columns that are not input variables
•UI/UXCode in development onboarding modals was not syntax highlighted
•UI/UXCreate test card content would overflow improperly
•UI/UXSample projects would not show button for creating suggested tests after some were created
•UI/UXGraphs in monitoring test cards were cut off
•UI/UXRequests table would break when rows were missing columns
•UI/UXFull-screen onboarding pages would not allow scrolling when overflowed
•UI/UXOptions were sometimes duplicated in heatmap dropdowns
•UI/UXThresholds would not faithfully appear in test result graphs
•UI/UXSkipped evaluations would not appear in test result graphs
$ openlayer push
Stop guessing.
Ship with confidence.
The AI governance and observability platform
We value your privacy
We use cookies to enhance your browsing experience, serve personalized content, and analyze our traffic.