This week we shipped a huge set of features and improvements, including our solution for regression projects!
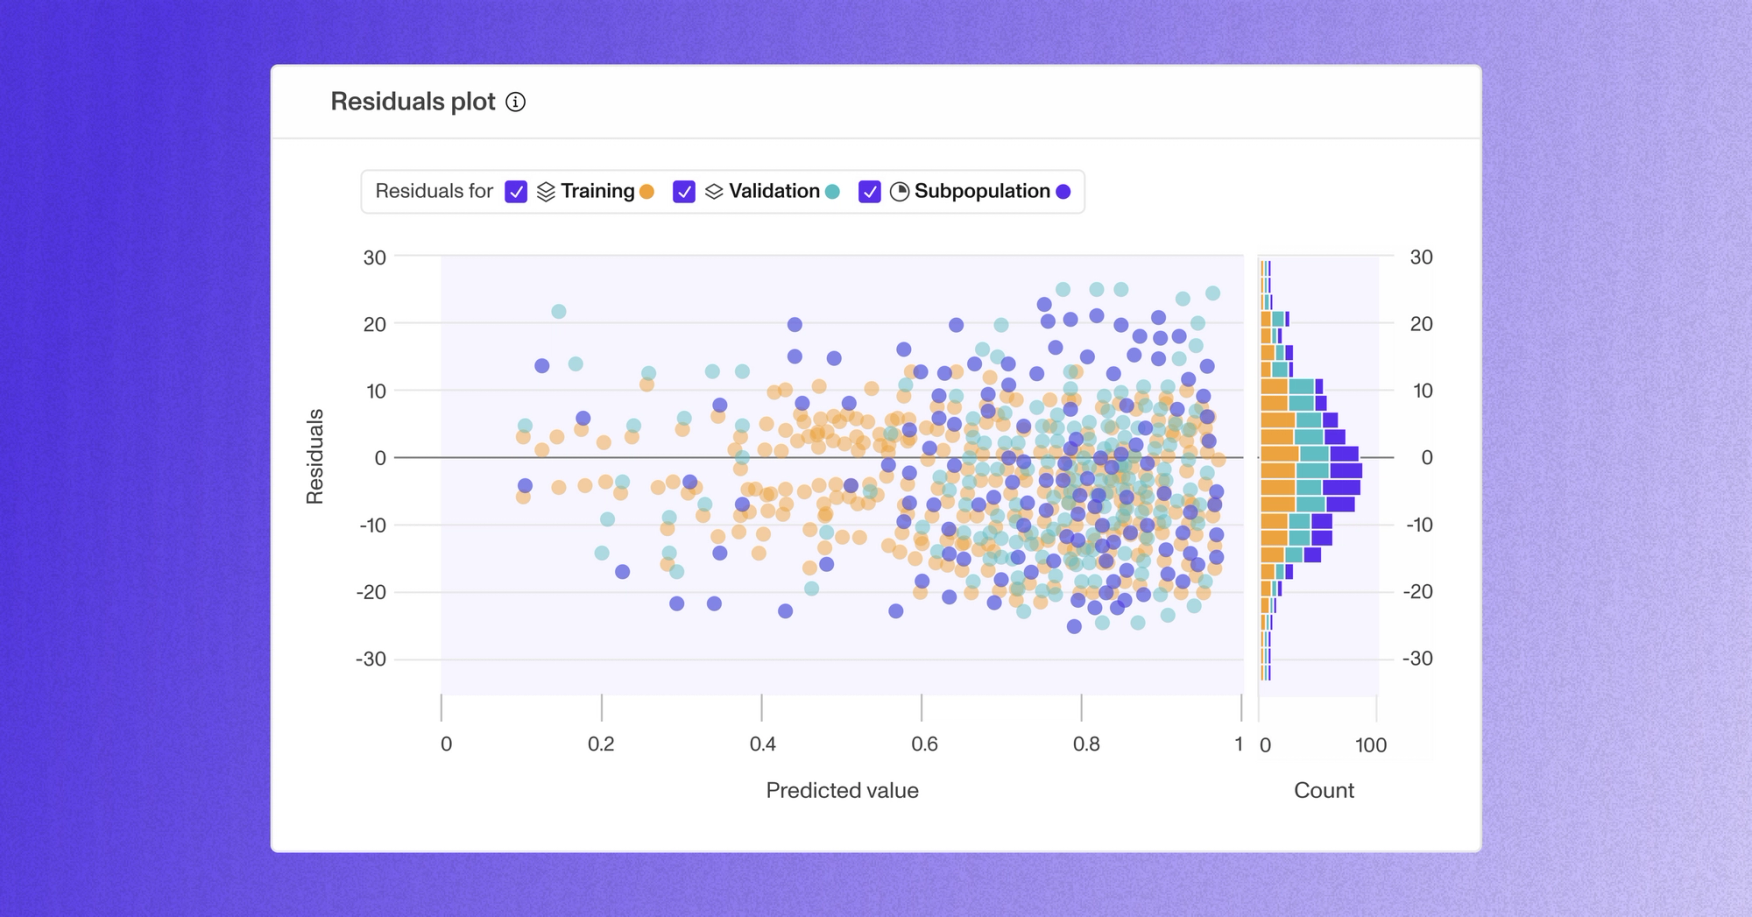
Finally, you can use Openlayer to evaluate your tabular regression models. We’ve updated our suite of goals for these projects, added new metrics like mean squared error (MSE) and mean absolute error (MAE), and delivered a new set of tailored insights and visualizations such as residuals plots.
This update also includes an improved notification system: toasts that present in the bottom right corner when creating or updating goals, projects, and commits. Now, you create all your goals at once with fewer button clicks.
Last but not least, you can now download the models and datasets under a commit within the platform. Simply navigate to your commit history and click on the options icon to download artifacts. Never worry about losing track of your models or datasets again.
Features
•PlatformAdded support for tabular regression projects
•UI/UXToast notifications now present for various in-app user actions, e.g. when creating projects, commits, or goals
•PlatformEnabled downloading commit artifacts (models and datasets)
•PlatformAllowed deleting commits
Improvements
•UI/UXImproved graph colors for dark mode
•UI/UXCommits within the timeline now show the time uploaded when within the past day
•UI/UXCommit columns in the timeline are now highlighted when hovering
Fixes
•UI/UXSentence length goals would not render failing rows in the goal diagnosis modal
•UI/UXFiltering by non-alphanumeric symbols when creating performance goals was not possible in text classification projects
•UI/UXChanging operators would break filters within the performance goal creation page
•UI/UXHeatmap labels would not always align or overflow properly
•UI/UXBuggy UI artifacts would unexpectedly appear when hovering over timeline cells
•UI/UXSorting the timeline would not persist the user selection correctly
•UI/UXQuasi-constant feature goals would break when all features have low variance
•UI/UXSelection highlight was not visible within certain input boxes
•PerformanceNaN values inside categorical features would break performance goal subpopulations
•PerformanceHeatmaps that are too large across one or both dimensions no longer attempt to render
•UI/UXConfidence distributions now display an informative error message when failing to compute
$ openlayer push
Stop guessing.
Ship with confidence.
The AI governance and observability platform
We value your privacy
We use cookies to enhance your browsing experience, serve personalized content, and analyze our traffic.