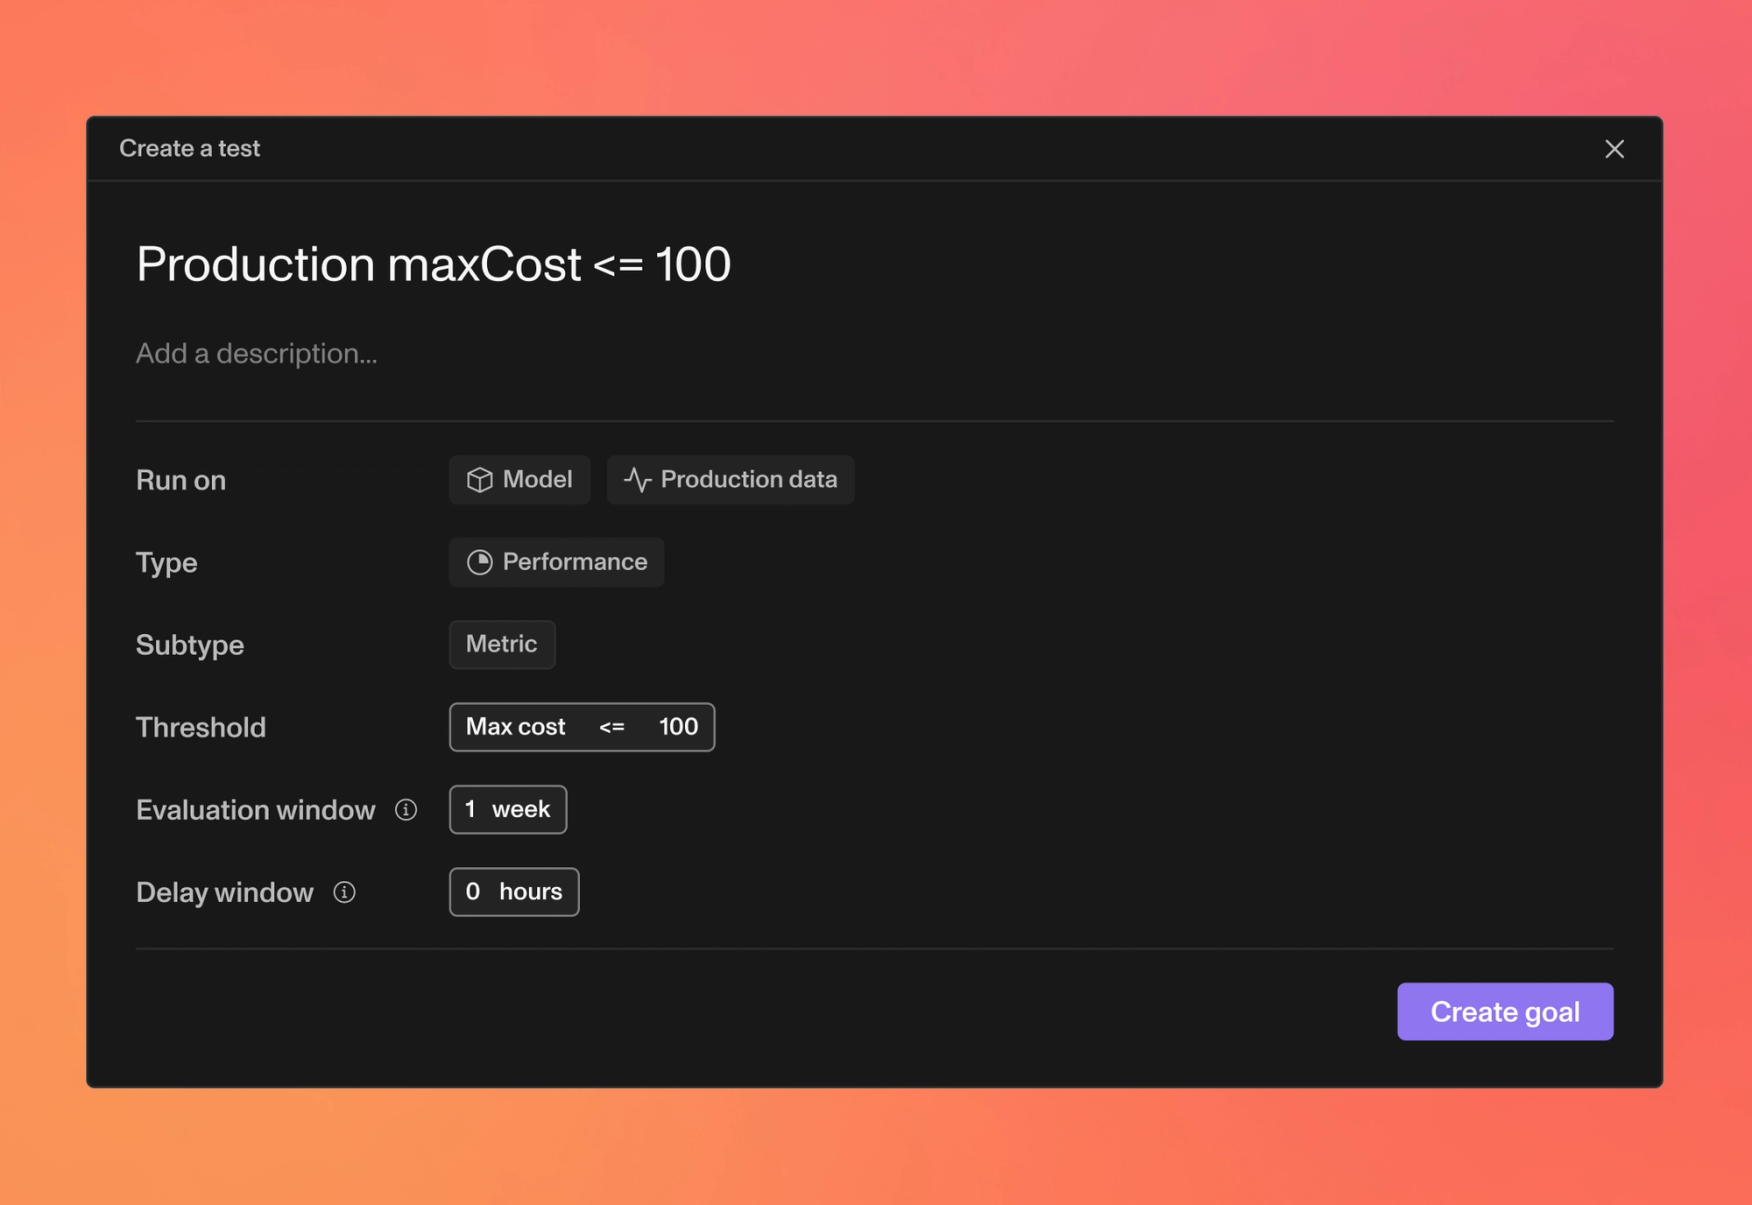
We’re excited to introduce the newest set of tests to hit Openlayer! Make sure column averages fall within a certain range with the Column average test. Ensure that your outputs contain specific keywords per request with our Column contains string test, where the values in Column B must contain the string values in Column A. Monitor and manage your costs by setting Max cost, Mean cost, and Total cost tests.
As additional support for managing costs, we now show you the cost of every request in the Requests page.
You can now filter data when creating integrity or consistency tests so that the results are calculated on specific subpopulations of your data, just like performance goals.
That’s not all, so make sure to read all the updates below. Join our Discord community to follow along on our development journey, and stay tuned for more updates from the changelog! 📩🤝
Features
•EvalsNew tests (Column average test – make sure column averages fall within a range, Cost-related tests – max cost, mean cost, and total cost per evaluation window) Column contains string test – column B must contain the string in column A)
•PlatformView your production data associated with each of your tests in monitoring mode
•ObservabilitySupport for cost-per-request and cost graph
•PlatformFilter rows by row-level metrics such as conciseness
•EvalsSubpopulation support for data goals
•UI/UXThe timeline page is back - see how your commits perform on goals over time
Improvements
•PlatformAbility to update previously published production data by setting existing columns or adding new columns
•PerformanceSample requests are paginated
•PerformanceLatency rendered in ms in the requests table
•UI/UXRequests filters no longer require selecting a filter type
•UI/UXSuggested tests modal auto-opens after project creation outside of the onboarding
•UI/UXNotifications callout not shown until the project is fully setup
•UI/UXEnabled filtering without datasets in development and monitoring modes
•PerformanceRender cost in requests table
•PerformanceRender monitoring data correctly in test diagnosis modals
•EvalsRow-level scores and explanations rendered for gpt-based metric tests
•UI/UXActivity log is now collapsible
•UI/UXIndividual rows in data tables within the test diagnosis modal can be expanded
•UI/UXInput and output columns rendered next to each other in data tables
•SDKsNew example notebook showing how to send additional columns as metadata with the monitor
•SDKsCleaned up example notebooks
Fixes
•UI/UXIrrelevant reserved columns no longer presented in requests table
•UI/UXColumn filtering did not dismiss in requests page
•UI/UXButton to create commit from UI was rendered for non-LLM projects
•PlatformNavigating back from certain pages was broken
•UI/UXDismissing modals caused the app to become unresponsive
•UI/UXMonitoring onboarding modal did not open
•PerformanceProduction tests with subpopulation filters rendered incorrect insights in results graph
•UI/UXClicking outside of dropdowns within a modal dismissed the whole modal
•UI/UXImproved discoverability of the data points that a test is run on in test diagnosis modal
•UI/UXSubsequent pages of monitoring requests would not always render
•UI/UXSome rows contained latency, cost, and tokens columns even if they were left unspecified
•UI/UXSuggested test modal reappeared unexpectedly
•UI/UXWhen table columns are very large, other columns were not readable
•UI/UXLLM rubric tests did not show score or explanations in monitoring
•UI/UXRequests pane was not scrollable
•UI/UXSome error states for test creation and results weren’t being shown
•UI/UXColumn Value test title was not updating upon threshold change
•UI/UXDefault color scheme to system
•SDKsAdded new and updated existing examples of how to incorporate the Openlayer TypeScript client for various use cases
•UI/UXData table columns no longer cut off
$ openlayer push
Stop guessing.
Ship with confidence.
The AI governance and observability platform
We value your privacy
We use cookies to enhance your browsing experience, serve personalized content, and analyze our traffic.