

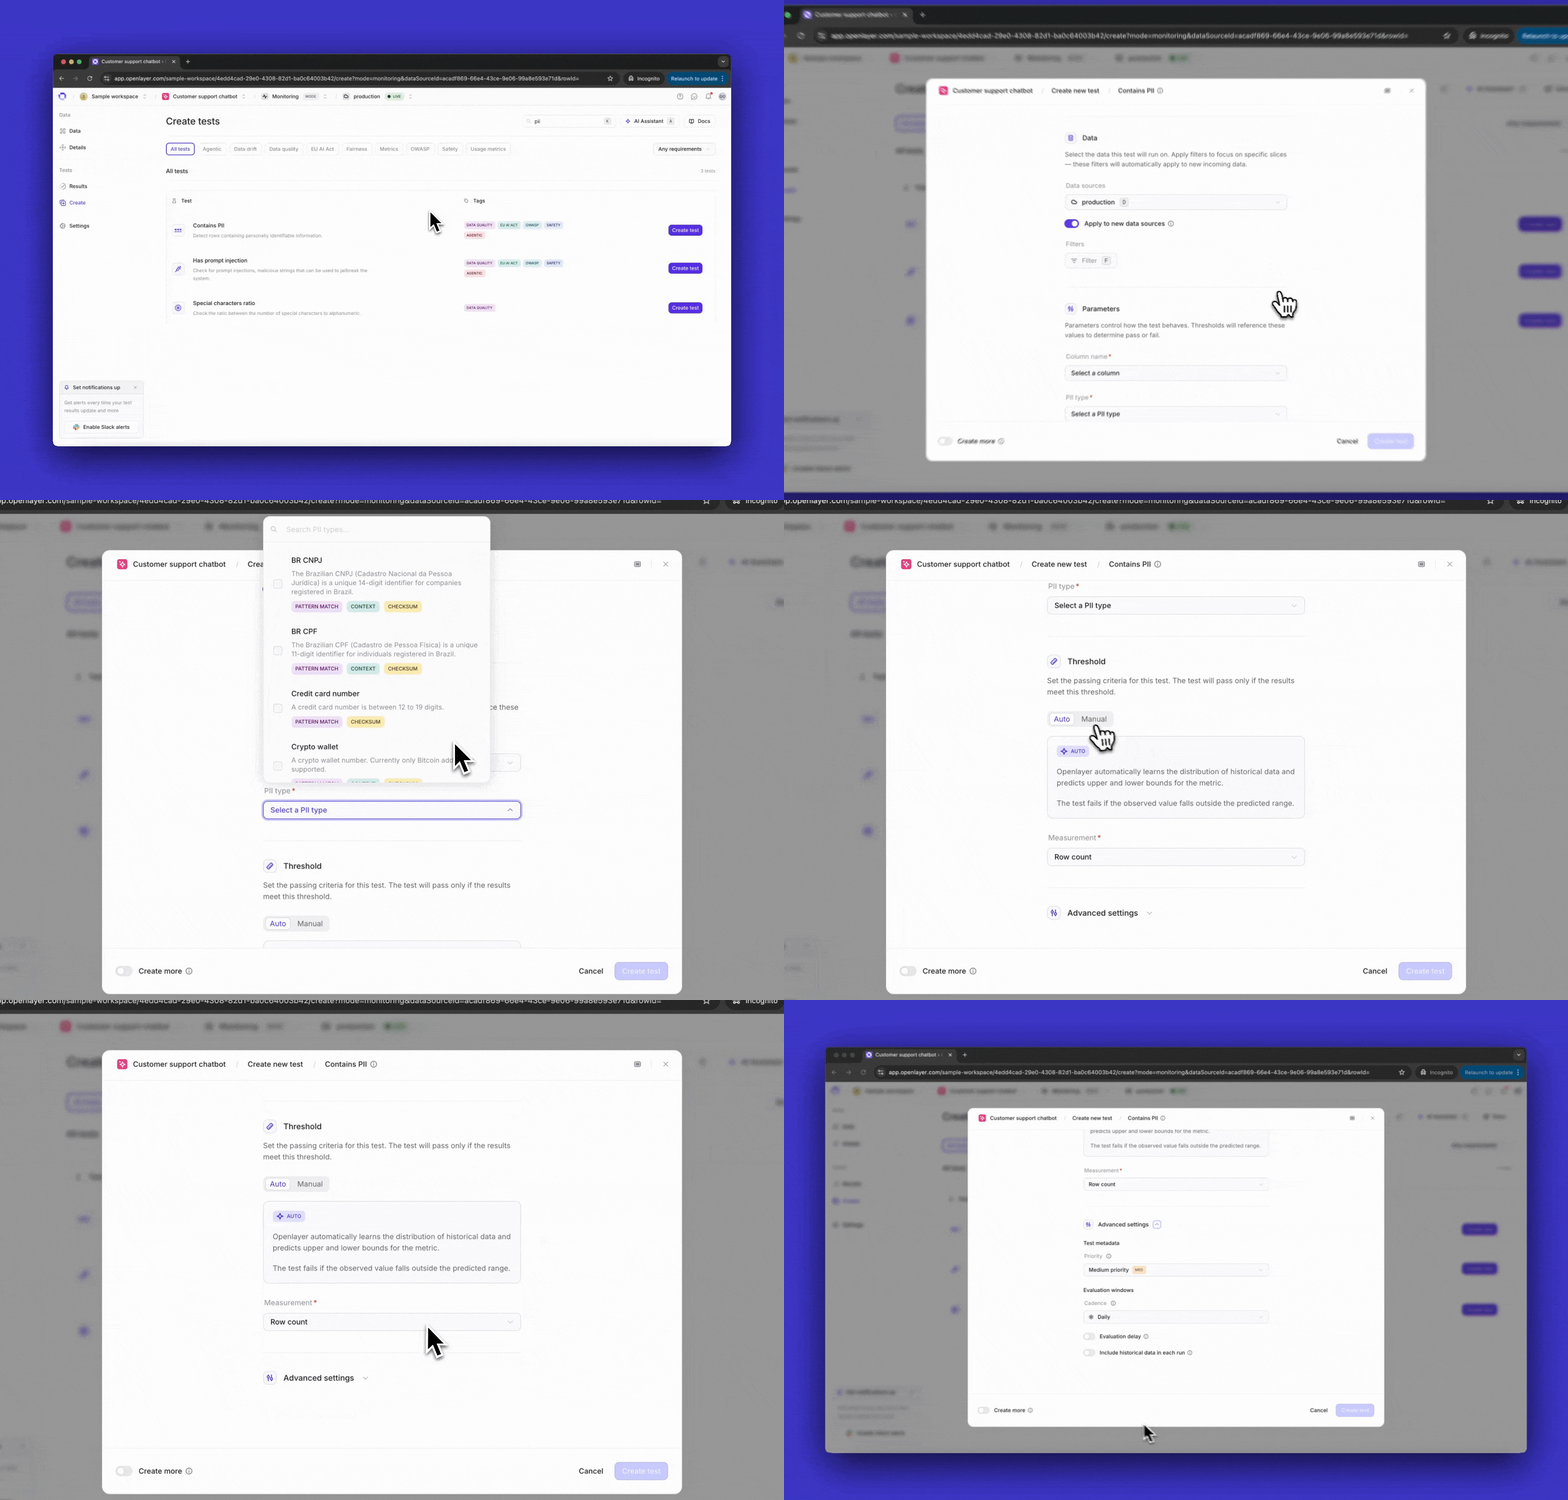
Configurations
The configurations available are:Data
Data
The “Data” section allows you to select the data on top of which this test will run.In monitoring mode, it means choosing among your data
sources (e.g., production data, staging data, etc.) In
development mode, it means selecting among your datasets
(e.g., training, validation, etc.)You can also apply filters to narrow the test to specific slices of the data, and
turn on Apply to new data sources so the test covers data sources you connect
later. When you fill in a filter, the value picker suggests values from your data —
see Filter value suggestions.In monitoring mode, the section also holds the Evaluation windows settings: the
Cadence the test runs on (Scheduled or Manual), plus the
Evaluation delay, Include historical data in each run, and Anchor
evaluation windows toggles. See
Evaluation and delay windows for details.
Parameters
Parameters
Some tests include configurable parameters that control their behavior.
For example, a test such as the PII detection test
lets you specify which type of PII to detect (e.g., credit card numbers, social security numbers, etc.)Custom metrics can also declare their own configurable
parameters. See Configurable parameters
for details on how to define them.Refer to the specific test page in the Catalog for details
on its parameters.For LLM-as-a-judge tests, the
Judge settings hold the judge model and the sampling controls that bound how much
data the judge scores: Sample size (%) (100 by default), Data limit (rows)
(50 by default), and the Sampling method (for example, Random). You can set the
same controls for every test in the project under Settings →
LLM-as-a-judge.
Threshold
Threshold
The “Threshold” section allows you to define the condition for the test to pass.On the Manual tab, you pick a Measurement, an Operator, and a
Threshold value — saying, for example, that the test passes if the metric is
greater than 0.5.In monitoring mode, most tests also offer an Auto tab.
With automatic thresholds, Openlayer automatically learns the distribution of
historical data and predicts upper and lower bounds for the metric. The test fails if
the observed value falls outside the predicted range.Automatic thresholds are directional: choose Both bounds to fail on either side of
the predicted range, or Upper only or Lower only to fail on one side only —
useful when a move in a single direction is what concerns you, such as a rising cost.
Advanced settings
Advanced settings
The “Advanced settings” section holds the test metadata. Here’s where you set
the test’s Priority.Cadence, delays, and anchoring live in the “Data” section — see
Evaluation and delay windows.